Memphis Rental Property #17
Last updated: 2025
NOTE: All figures and statements in this article were accurate as of the time of initial publication in 2020. Check out the Annual Updates section at the bottom of the post to see how the property has performed since then.
If you’re a regular reader of the blog, you may already be familiar with my origin story in real estate: after running the numbers in 2018 and realizing I could quit my corporate job faster than I ever imagined using out-of-state rental properties, I sold my NYC condo and some other stock investments and used the proceeds to buy up 16 cash-flowing rental properties in the Memphis area. It all happened in a flurry – less than a year passed between buying my first Memphis house and the sixteenth.
Another full year has passed since then. Because I use a property manager for day-to-day management of my portfolio, most of my work is front-loaded into the acquisition phase – scouting for properties, analyzing deals, making offers, arranging financing, examining inspection reports, and getting to the closing table. So after I bought the sixteenth property, things slowed down considerably. I’ve stayed (reasonably) busy keeping an eye on my portfolio and pursuing a variety of new projects, including creating this website and providing one-on-one coaching to new investors – but I haven’t bought any more rental properties.
Why not? The simple answer is that I ran out of money. Except for retirement accounts that I consider off-limits, I had invested all the rest. My hope was that, even after quitting my job, we would still make more money than we spent each month, and by investing those savings I’d be able to grow my portfolio at a more sustainable pace of 1-2 properties per year.
Or, to borrow language from a previous post, I wanted to keep “feeding the beast” so my “Magic Money Machine” could keep getting bigger:
Luckily, that all played out pretty much as expected, and after about eight months I had saved enough for my next down payment. So I kicked the acquisition engine back into gear, and started the search for Property #17.
More in Memphis, or Diversify?
The first decision I faced was whether to keep buying properties in Memphis, or diversify into a second market. I felt my portfolio was large enough that I could benefit from diversifying, and I was kind of excited to dive into a new market, so I spent a good amount of time researching several possibilities and networking with other investors and local experts.
My finalists were Birmingham, Kansas City, and Oklahoma City. They are all great markets for investment properties, but for reasons that I’ve previously discussed in my article on market evaluation, I ultimately came back to Memphis. As a refresher, here’s a comparison of some of the key criteria I use in my evaluation:
Not only do I think Memphis has the largest volume of good cash-flowing rental properties and a strong price-to-rent ratio, it also has low taxes, stable population trends, and low risk of flooding and other natural disasters. Plus, I had momentum and knowledge in the market: I already had a strong property manager I trusted, along with other local contacts, and I knew exactly which neighborhoods would meet my goals. (For more, check out my summary of the 12 Best Cash Flow Markets.)
I haven’t closed the door to diversifying into a second market in the future, but for now, I’m staying in Memphis.
House #17 Financials
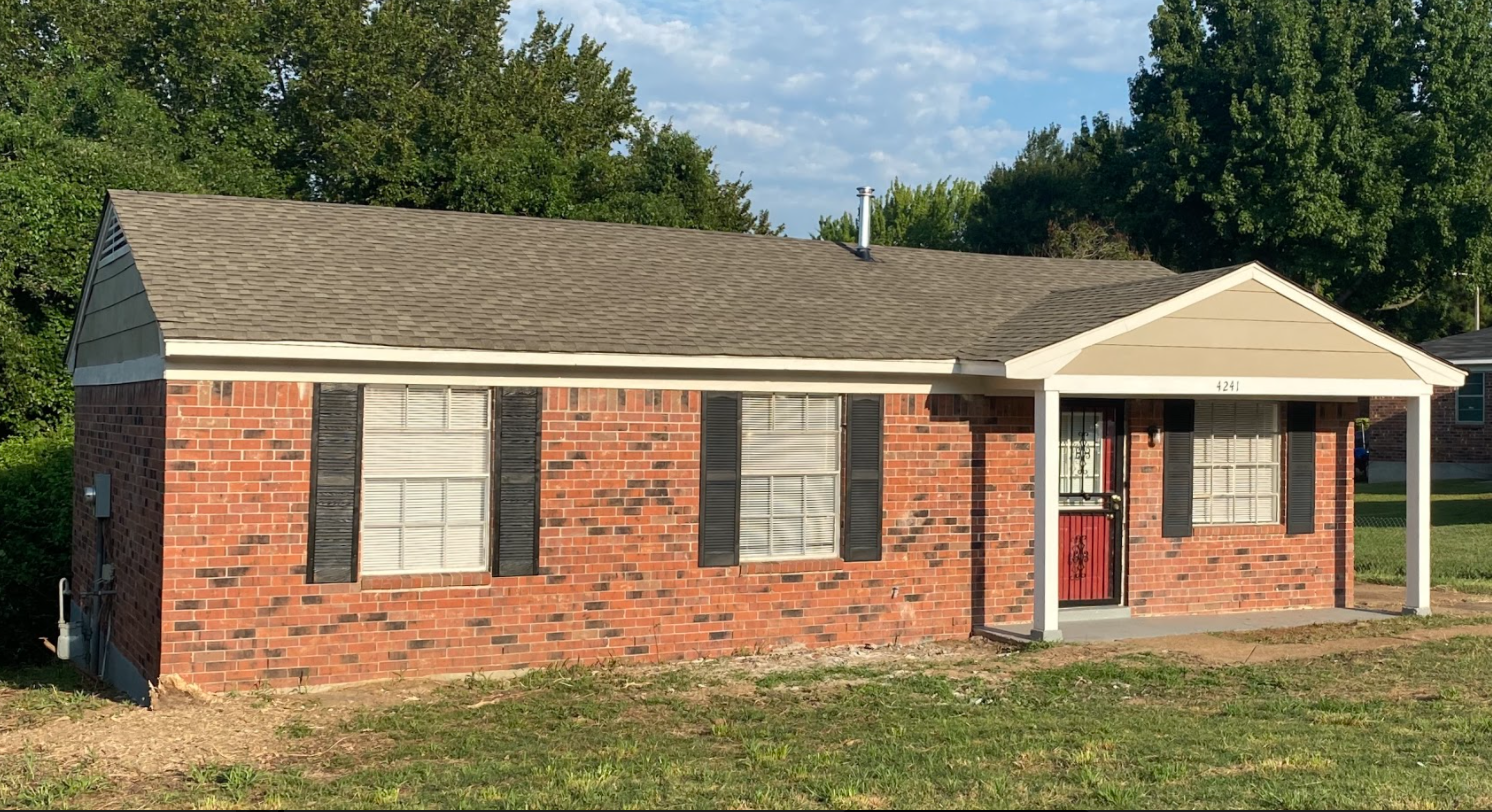
It took a while to find the right deal, but I eventually decided on a turnkey property from the same provider I’ve used several times in the past. I know he does good work, and delivers on what he says – and true to form, there were very few hiccups with this property. The house is in a C neighborhood (Frayser) that is very popular with Memphis investors. Renovated homes in this area are easy to rent, and produce strong cash flows. (I’m focusing on C neighborhoods for my next group of acquisitions — read more about why.)
I was actually quite happy to pick up another turnkey property. In the process of writing a recent article on turnkey properties, I looked closely at the historical data from my portfolio to see if my four turnkey properties had lower maintenance & repair costs than my other properties. Spoiler alert -- they did:
While this wasn’t terribly surprising, it was nonetheless impactful to see the actual numbers, and it reinforced my belief that turnkeys are a perfectly viable way for passive rental property investors to grow their portfolios. So when I saw a good turnkey property come up, I jumped at it.
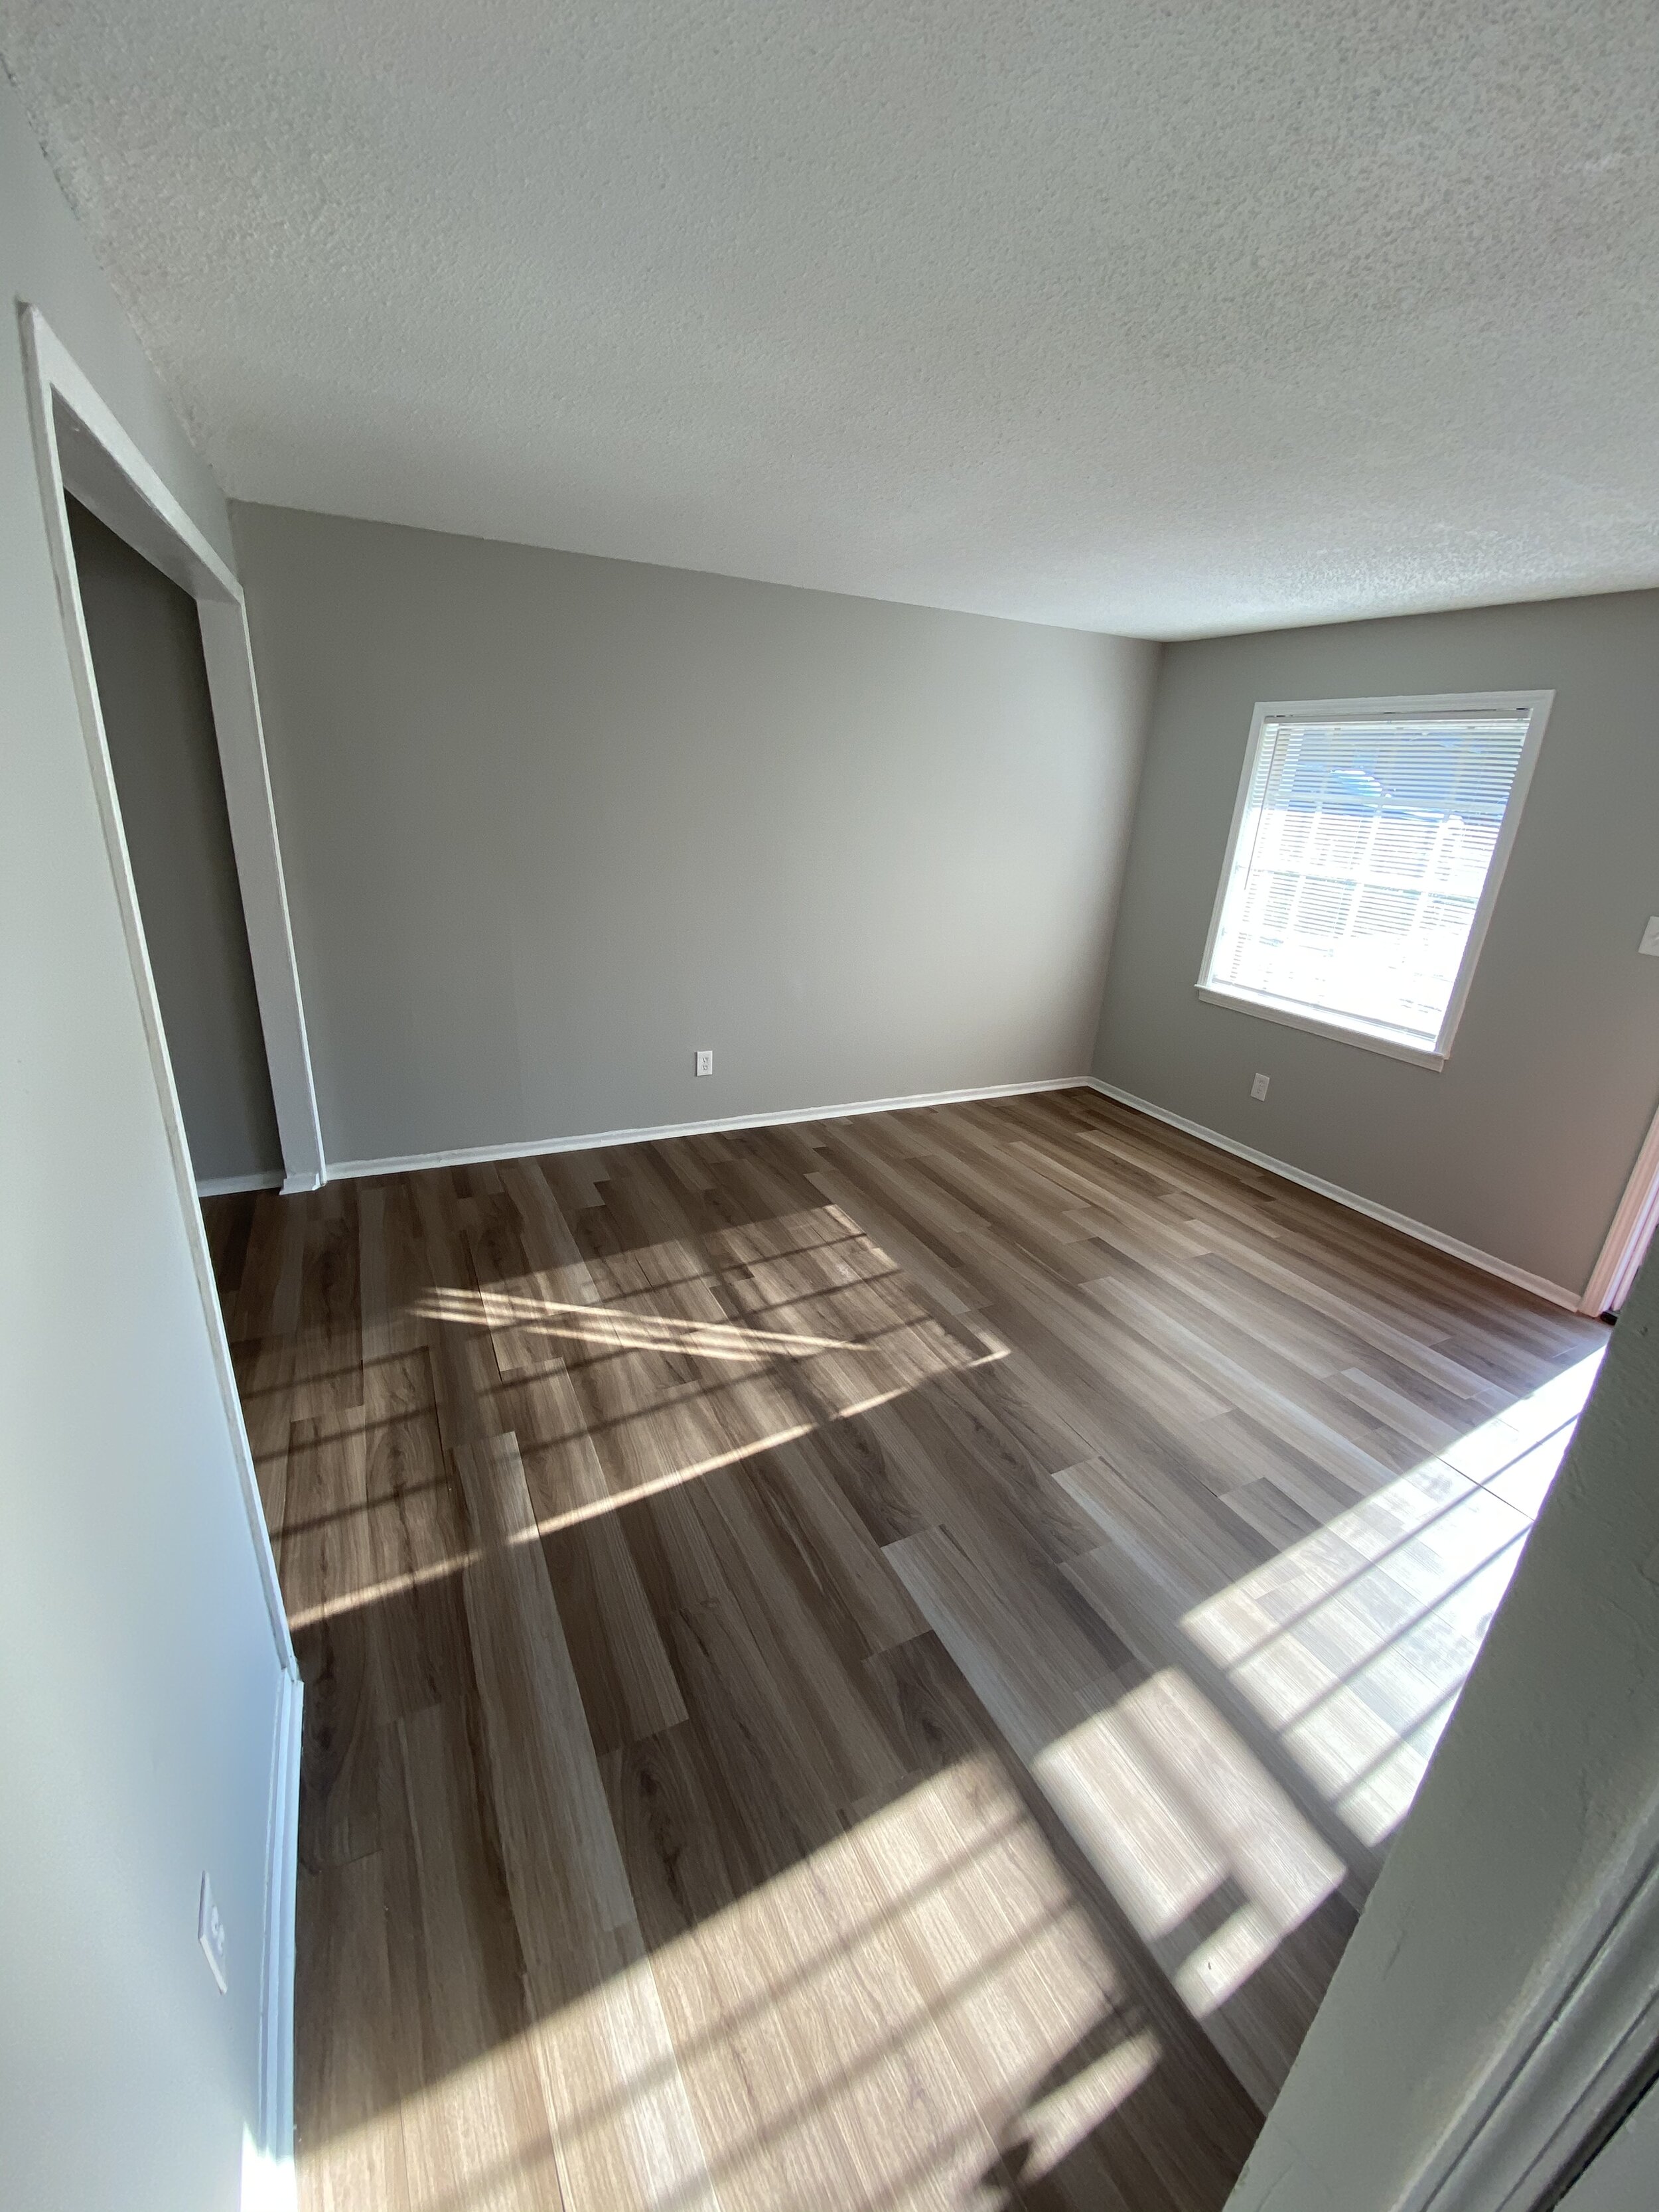
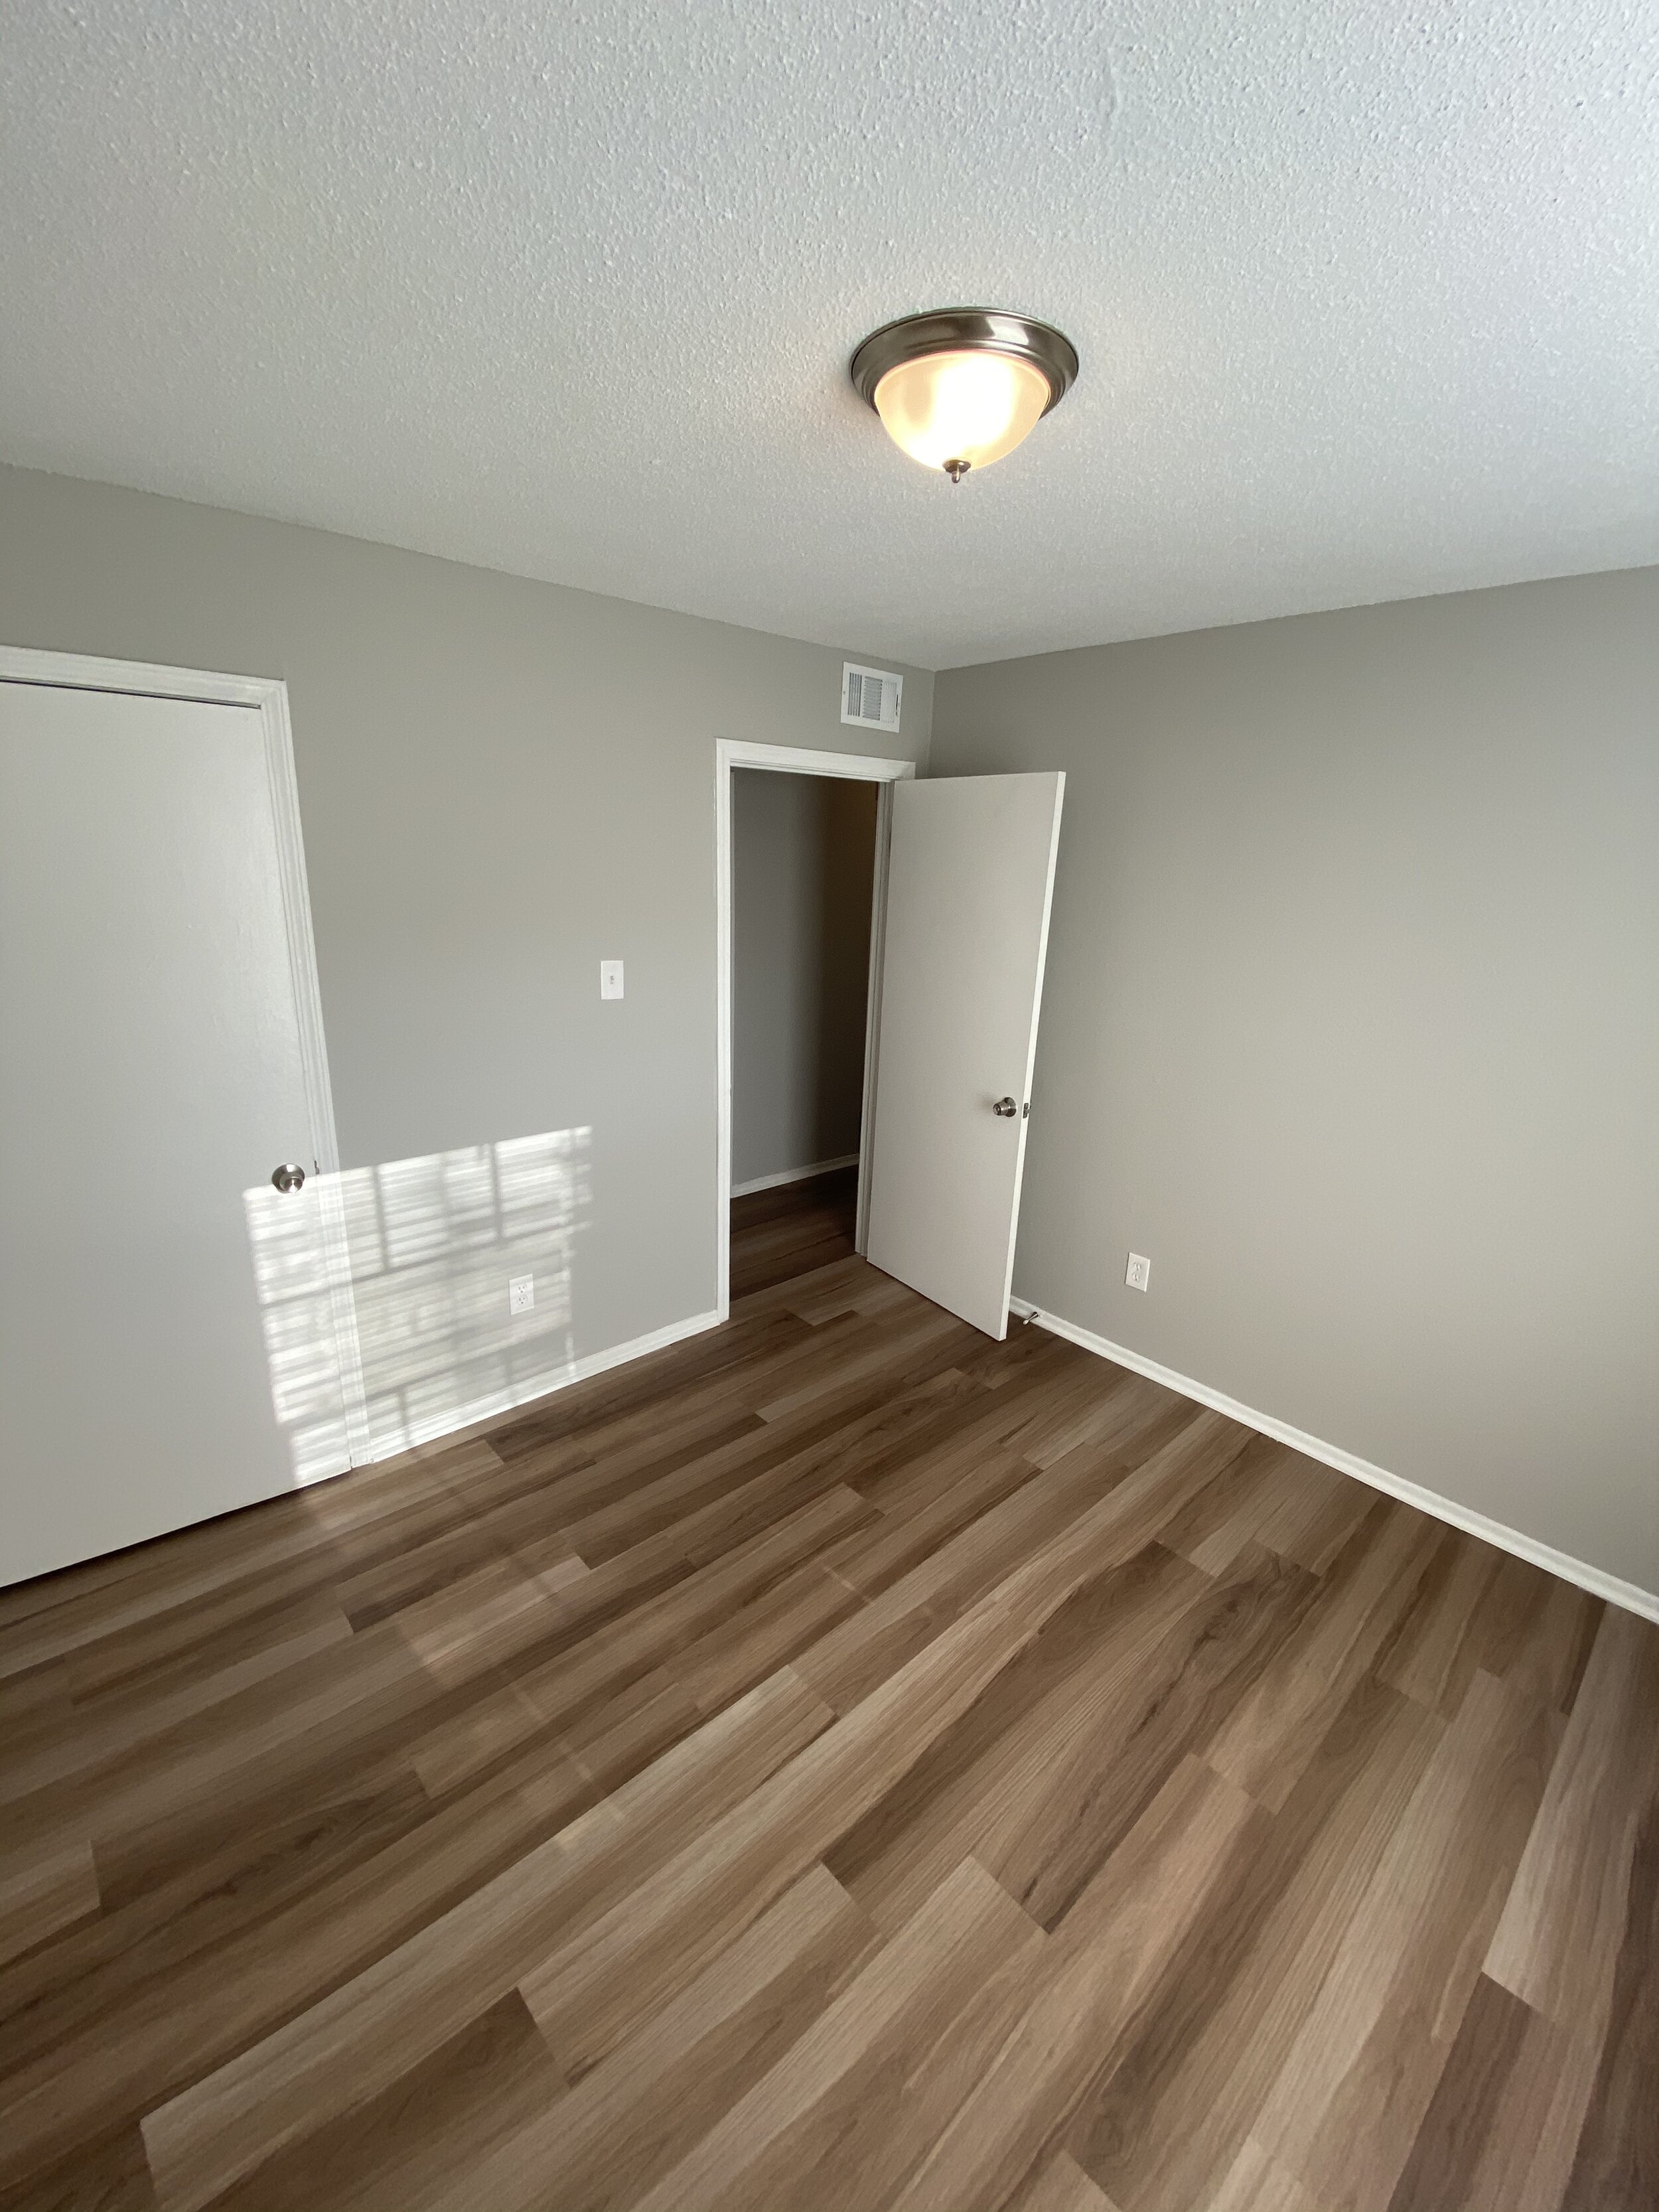
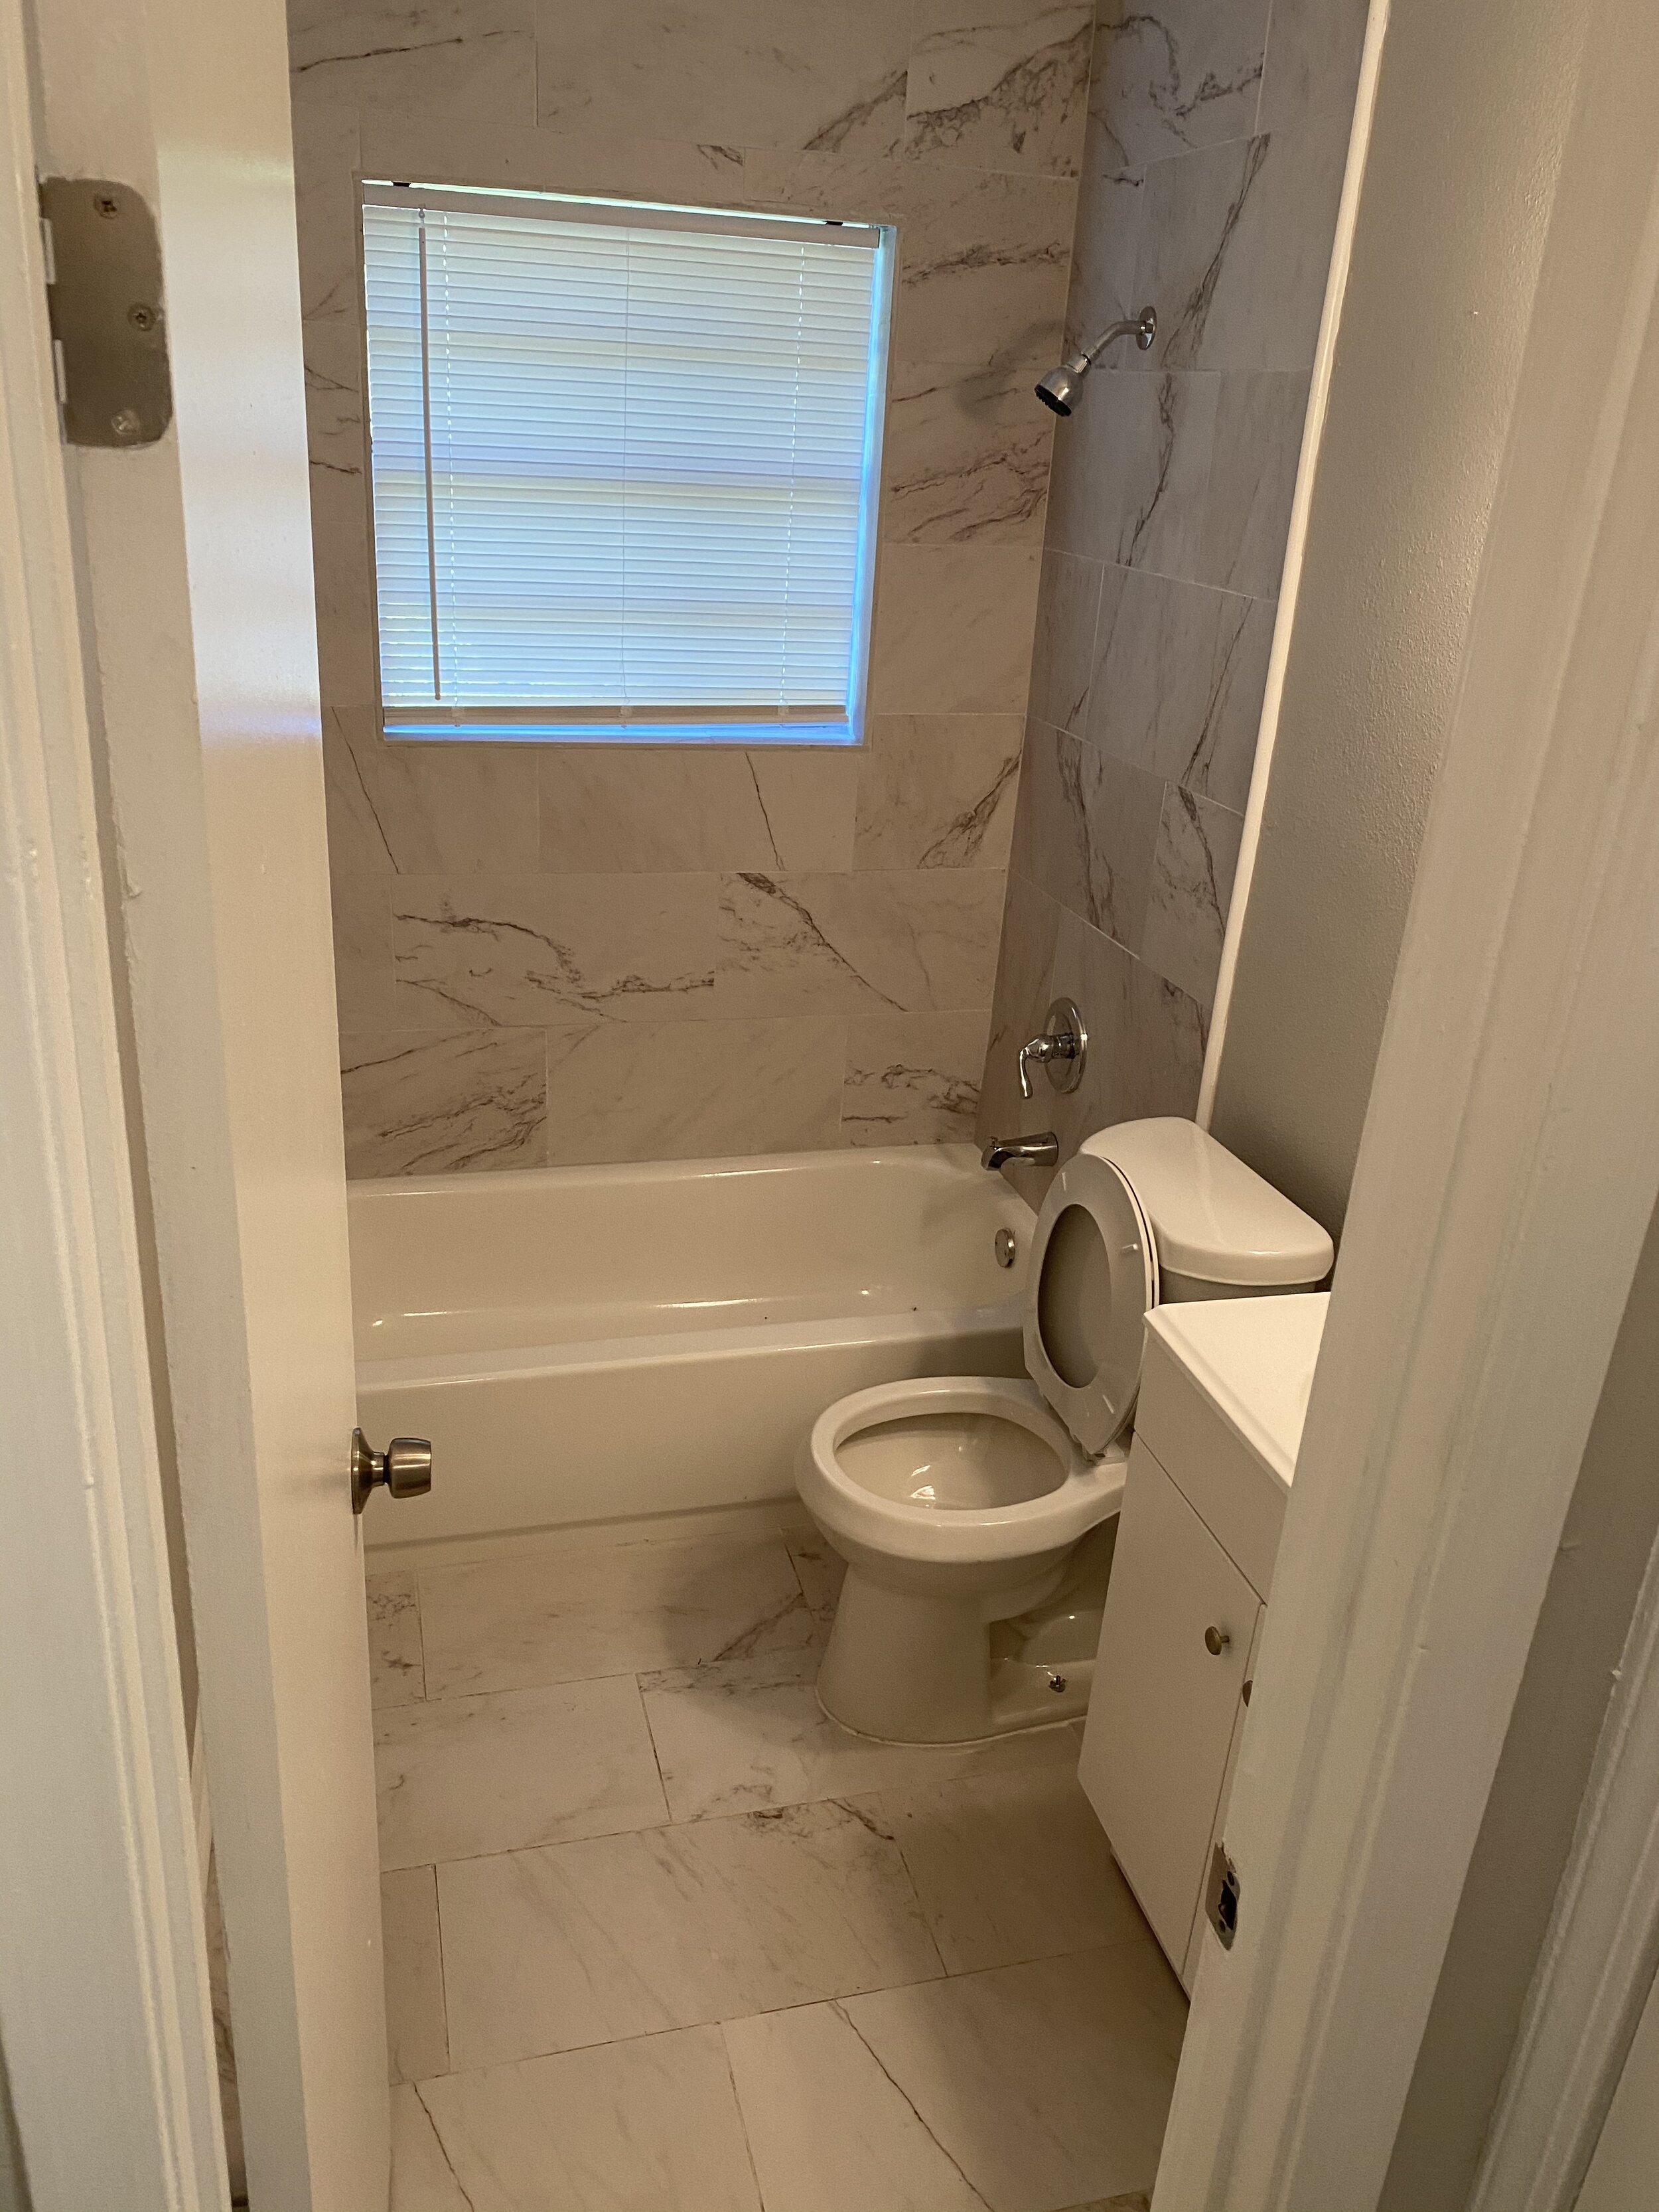
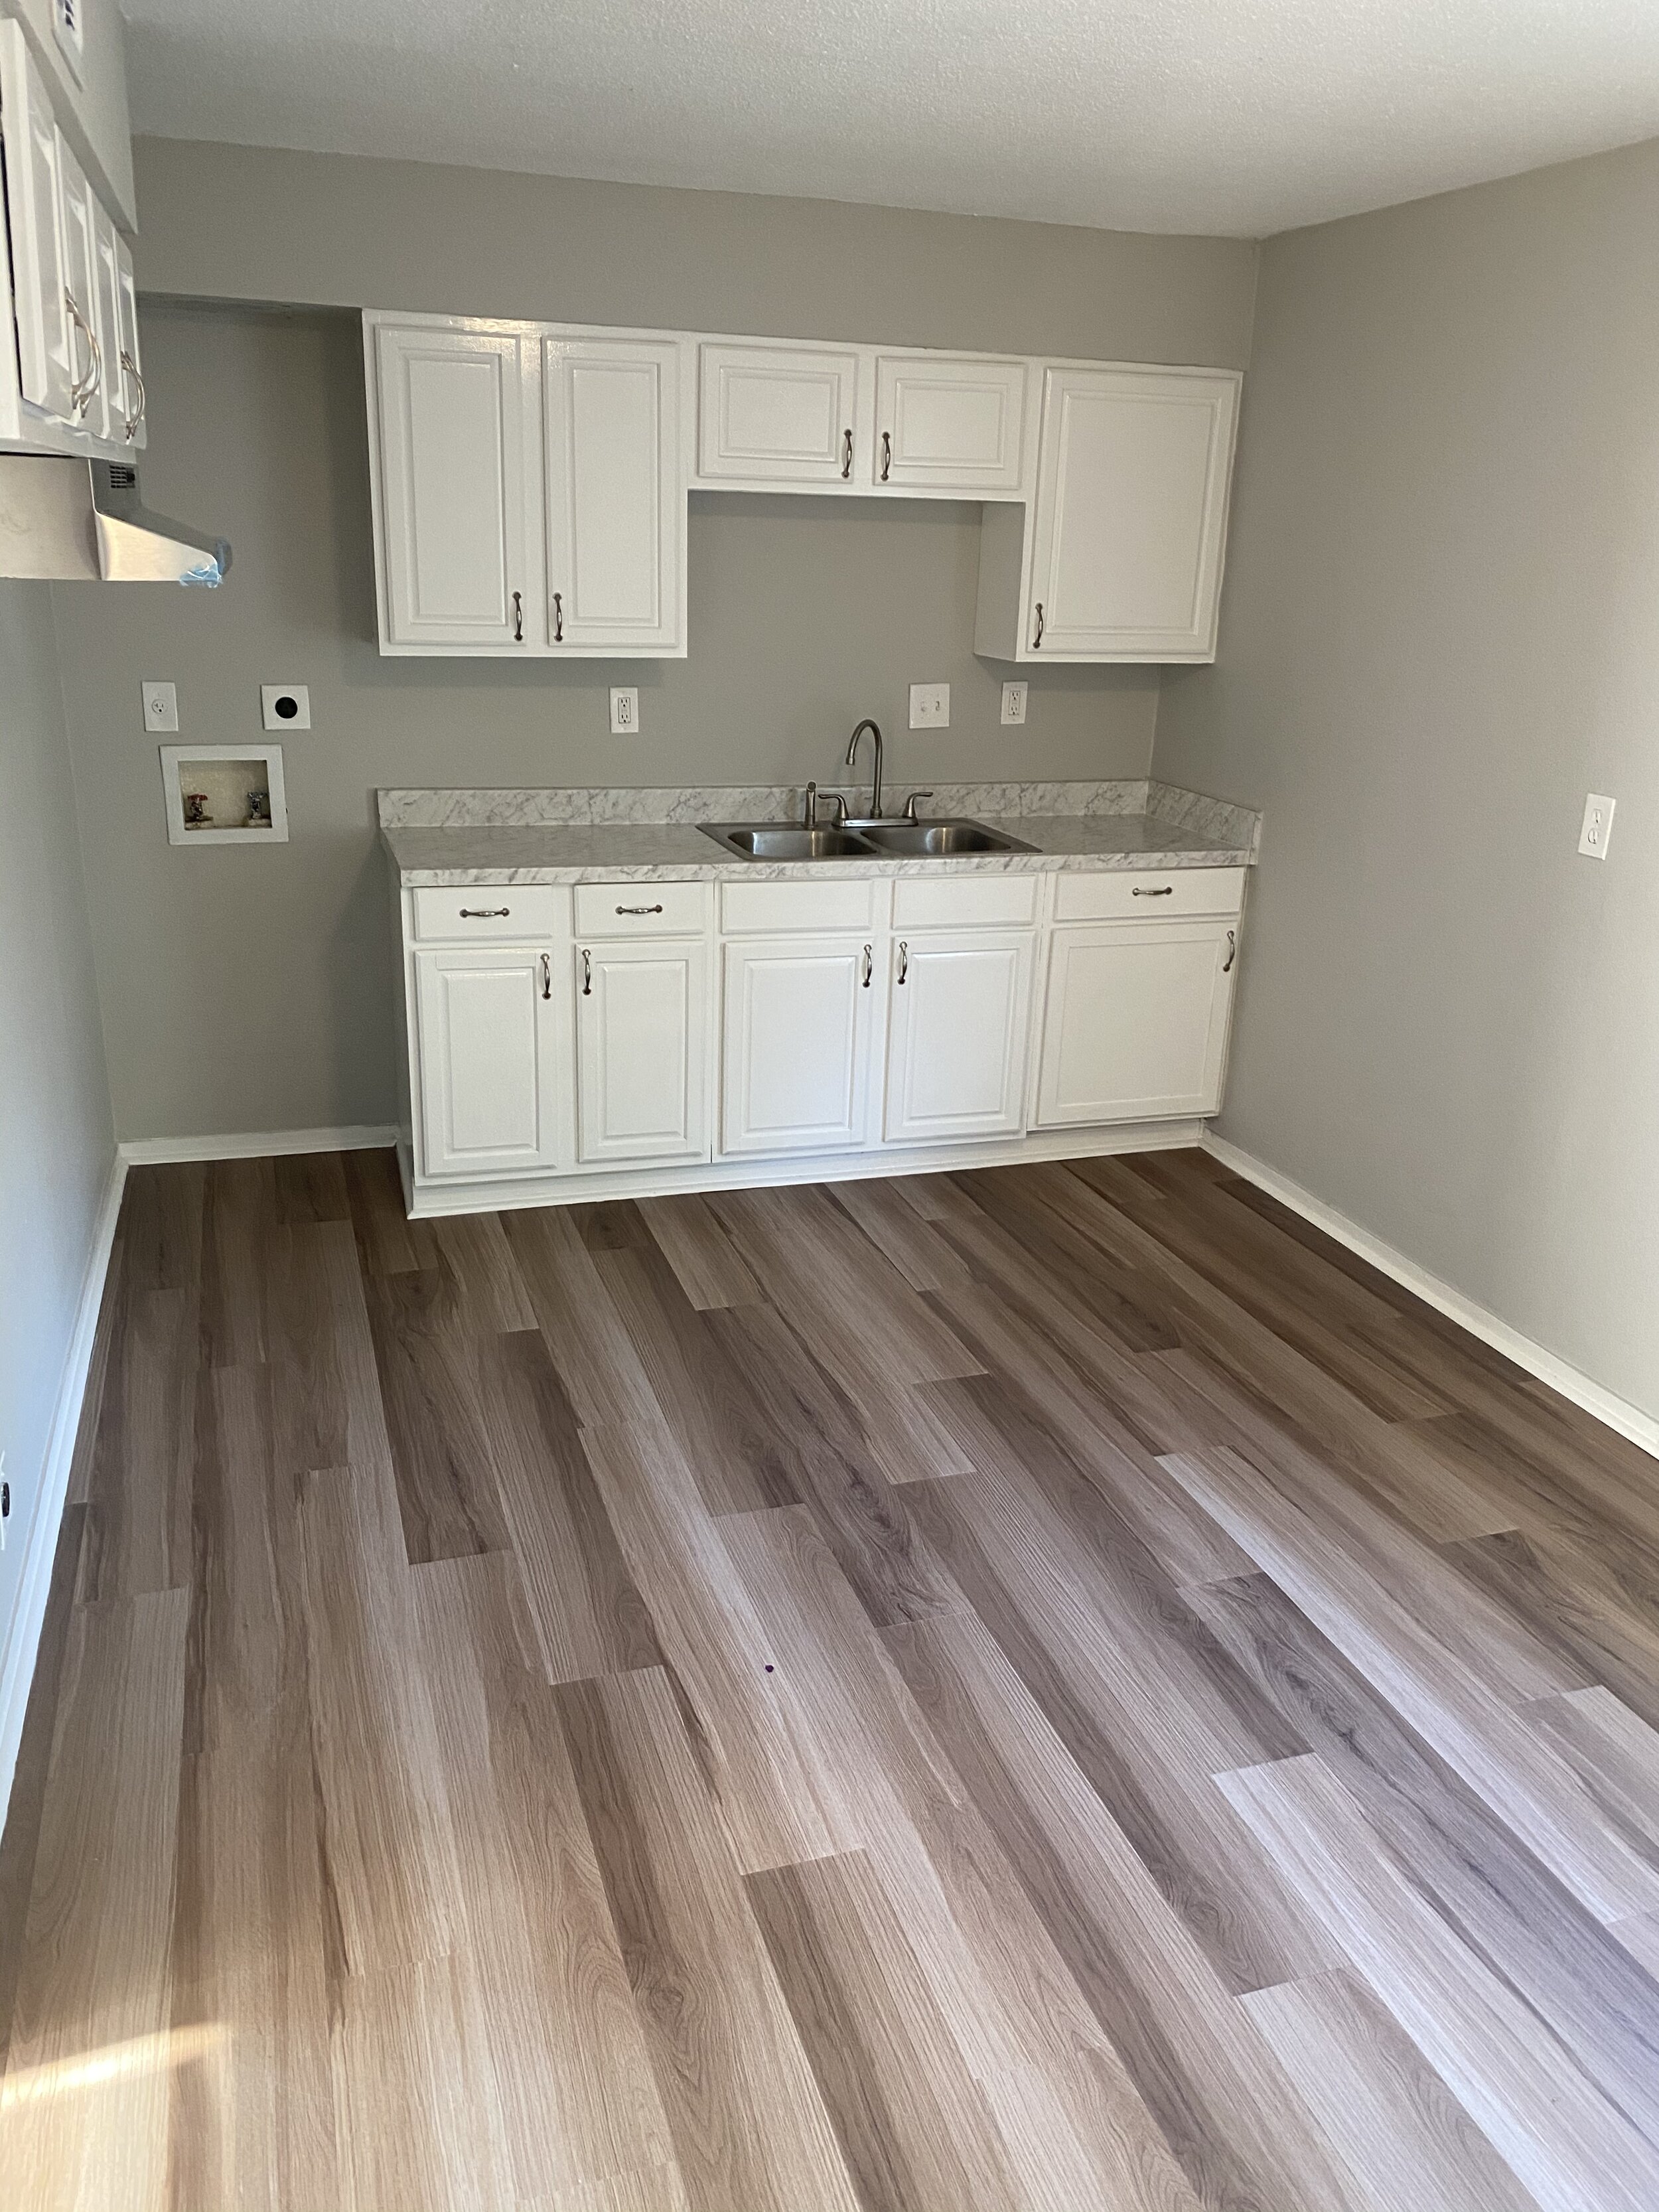
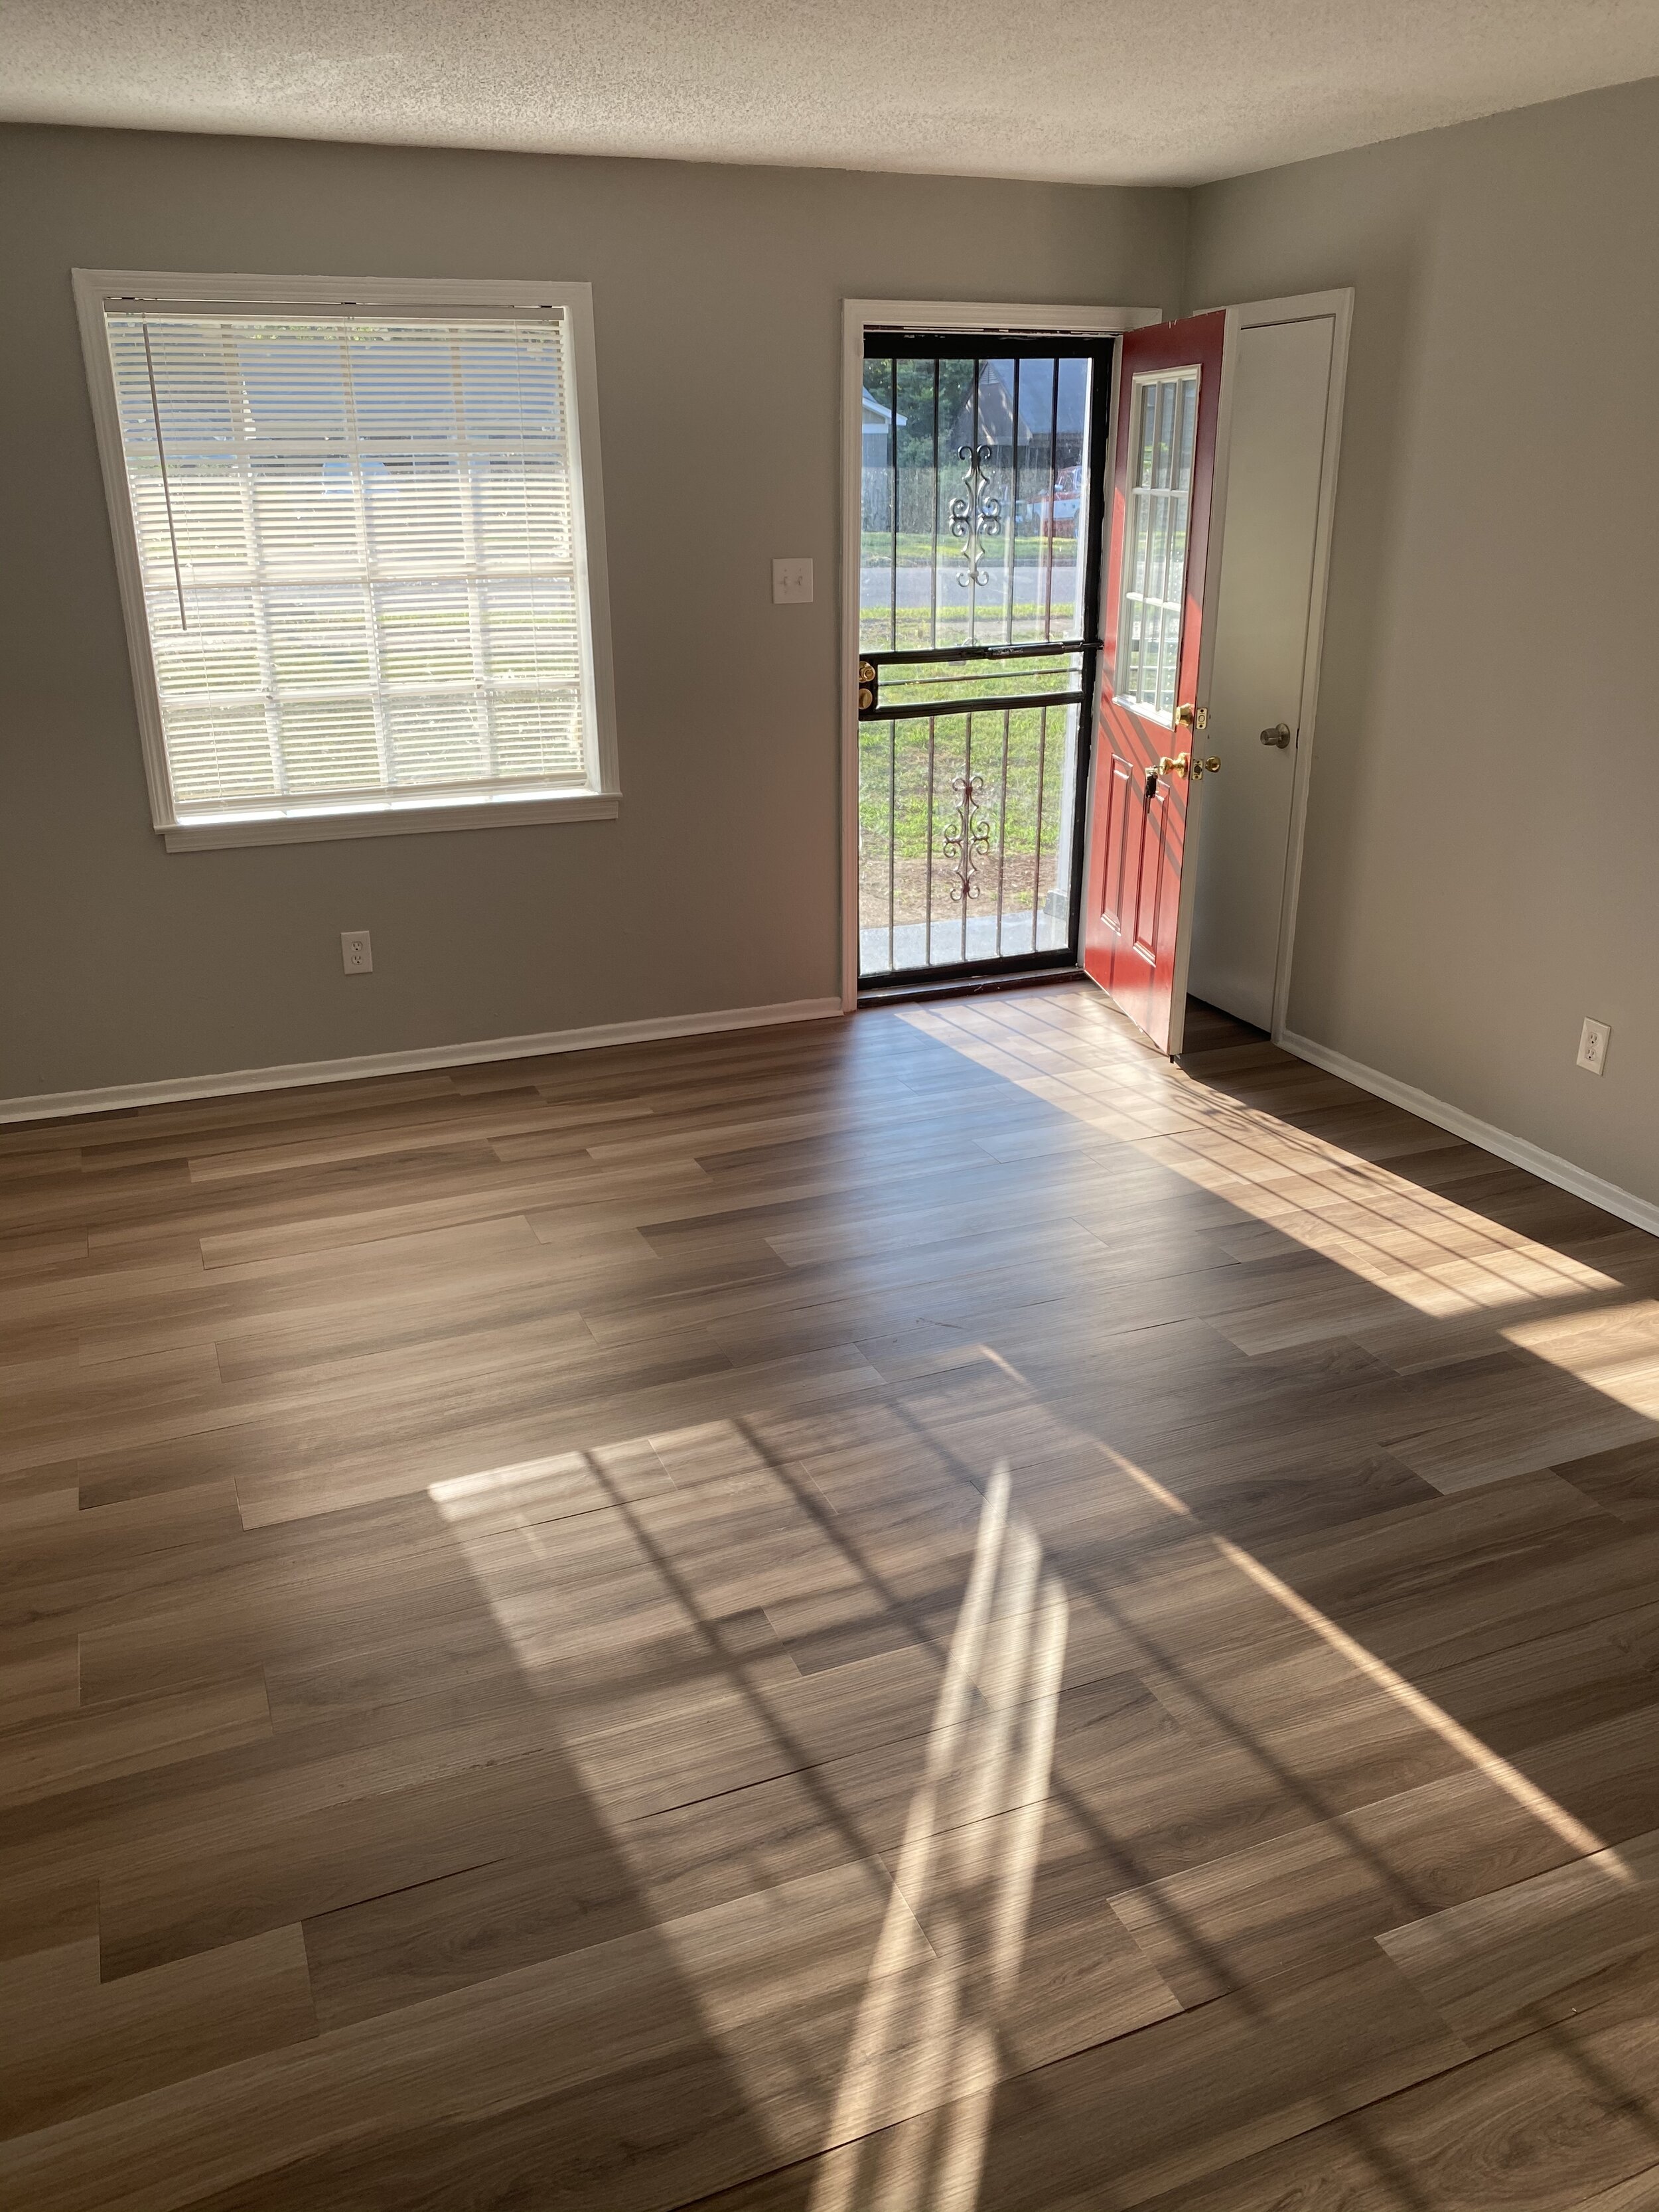
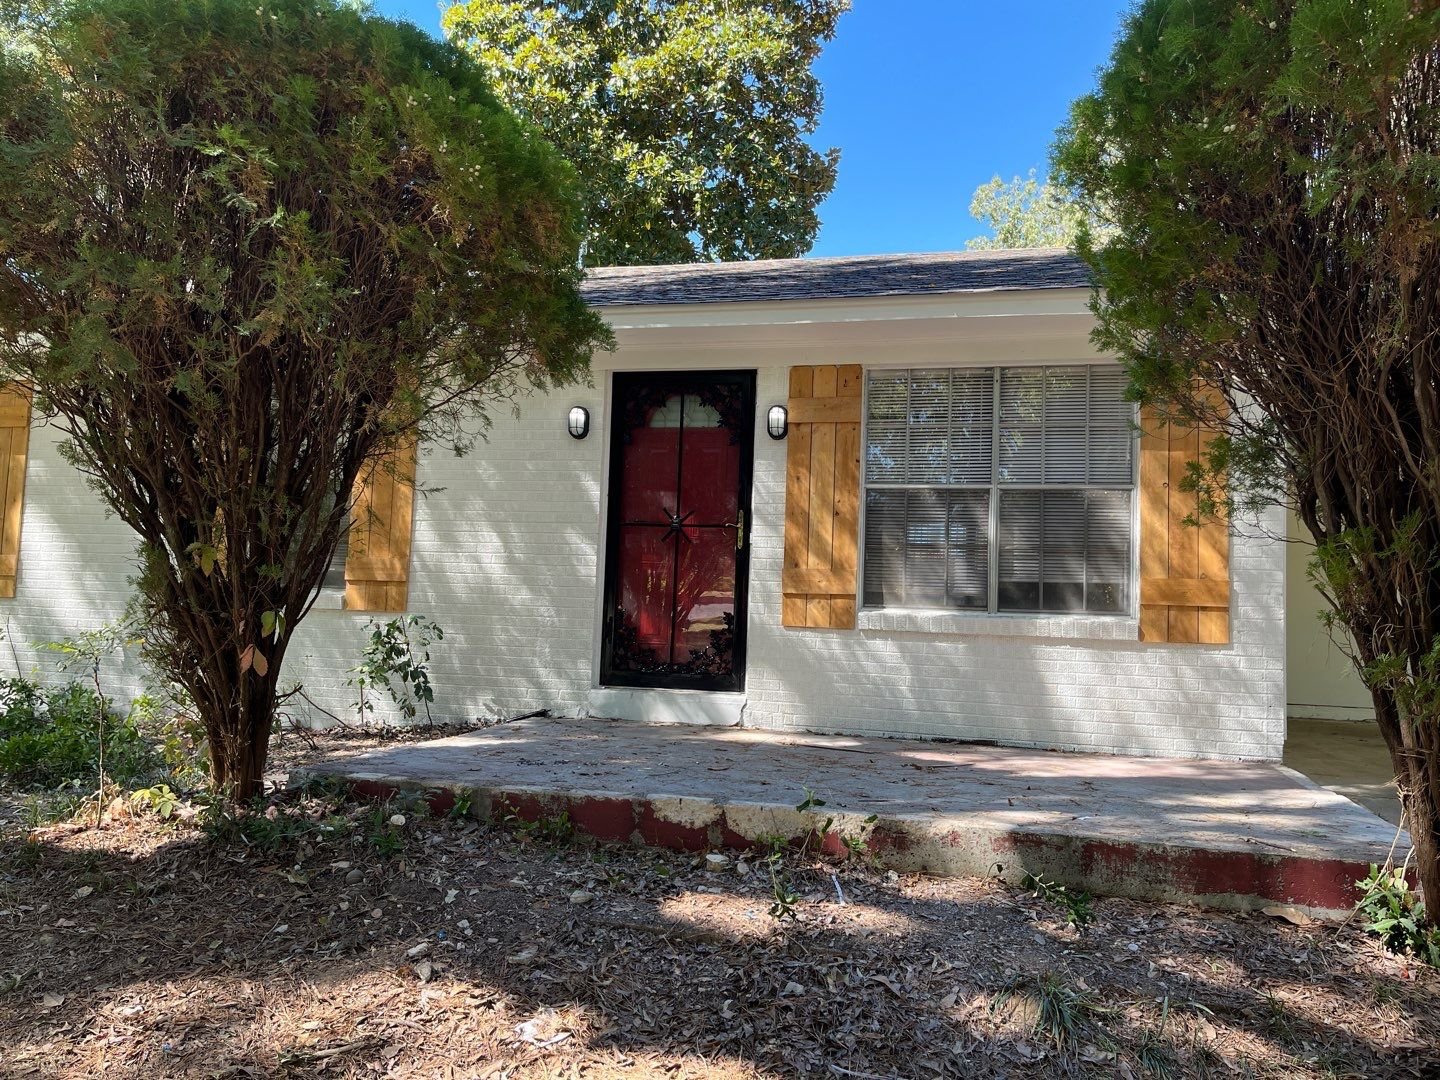
What does it look like? Well, here are some of the after photos to scratch your HGTV itch:
As with most turnkey properties, the rehab included new installations of all the major “cost centers” of a house, including roof, flooring, and HVAC. And with new finishes throughout the home, it looks clean, bright, and inviting.
But even if the property looks great, it’s only a good investment if the numbers work. I used the RIA Property Analyzer to run the numbers on this property – here are the key metrics:
Purchase Price: $67,000
Monthly Rent: $725
Monthly Cash Flow: $166
Cap Rate: 8.66%
Cash on Cash Returns: 9.16%
Total Returns w/ 2% Appreciation: 17.83%
(Want to use this tool yourself? You can!)
OR
Using the multi-year model in the RIA Property Analyzer, we can visualize some of the main long-term trends:
Cash flow increases over time. This is because rent and expenses are expected to rise with inflation, but one major expense (my mortgage) is fixed.
Cash Flow Year 1: $1,992
Cash Flow Year 10: $3,124
Cash Flow Year 25: $5,523
Mortgage paydown accelerates over time. This is because of the way banks amortize loans – each month, a little bit more of your fixed payment is principal, and a little bit less is interest.
Mortgage Paydown Year 1: $562
Mortgage Paydown Year 10: $1,007
Mortgage Paydown Year 25: $2,662
Total returns on cash increases over time. This is a consequence of the first two points – I will make greater total returns over time on the same initial investment of cash.
Total Returns on Cash Year 1: 17.9%
Total Returns on Cash Year 10: 26.4%
Total Returns on Cash Year 25: 47.5%
(Note in the last graph that returns on equity actually DECREASES over time. I will use a full article in the future to discuss Return on Equity, and how to use this metric to determine the optimal time to SELL an investment property and reinvest the equity into new properties.)
Overall, I’m quite happy with the returns on this property. They’re not exceptional, but they’re very solid. And I think I got the house at a very fair price. But two things could have made the numbers even better…
Rental Price
First, based on how I estimate market rent, I think this property could have easily rented for $50-$75/month more, which would have made the returns much more attractive. For example, if the rent were $800 instead of $725, the Cap Rate bumps up to nearly 10% and Cash on Cash to 13% — so that’s a big difference. The house rented so quickly after it was listed that by the time my feedback on the asking rent reached the right person, a tenant was already locked in.
But if I’m correct on this, I’ll be able to realize this upside pretty quickly in the next few years by raising rent.
Loan Costs
The other thing that hurt my numbers on this deal was higher loan costs. At this point, I’ve exhausted my ability to qualify for conventional mortgages: my spouse already has the maximum of 10 mortgages, and I can no longer qualify because in the absence of my W2 job, my debt to income ratio doesn’t meet banks’ qualification standards. (I’m hoping this will change in the future, because I still have several of those “golden tickets” left to use!) But for the time being, I’ve had to look for other “creative” means of financing my purchases.
In a future article, I will discuss all the alternative ways to finance real estate investments after your access to conventional mortgages dries up. (DEC2020 UPDATE: that article is now published, see 8 Ways to Fund Your Rental Property Purchases.) For this purchase, though, I decided to go with Kiavi, one of a handful of large companies that now provides “non-comforming” loans to real estate investors. “Non-conforming” just means that the loan doesn’t have to meet the normal Fannie Mae/Freddie Mac requirements for issuing a mortgage. In the case of Kiavi, these are “asset-based” loans, meaning the qualification standards have more to do with the property’s finances, and less to do with your own personal finances. Kiavi funds these loans with their own money, and they keep the loan on their books rather than re-selling the loan to another entity such as Fannie Mae or Freddie Mac, which is what happens with nearly all conventional mortgages.
I selected Kiavi because unlike many lenders who make non-conforming loans, they offer a 30-year fixed rate loan, which is the only kind of leverage I use for my rental properties – loans with adjustable rates and/or balloon payments are much riskier, so I choose not to use them.
My experience with Kiavi was decent, but like all alternative financing it came with costs and downsides – in this case, somewhat higher closing costs and a 6.5% interest rate. (At the time of writing, Kiavi currently has rates as low as 5% for larger loans, but because this was a baby loan of only $50K, the rate was a bit higher.) The same property with a 4.0% loan would increase my monthly cash flow by $80, and my cash-on-cash returns would jump from 9% to over 13%. Just goes to show have valuable those conventional loans are!
To sum up Property #17 and its financials, here’s the full “deal sheet”:
Finally, let me address one more point that has been on a lot of minds recently: will the coronavirus pandemic impact real estate, and is now the right time to buy rental properties?
Rental Properties and the Pandemic
So far, the pandemic’s impact on the housing sector has been pretty muted. While many dense urban areas are seeing slowdowns and price reductions, surrounding suburban areas with single-family homes are booming – and those are the areas where most landlords invest. For example, the sales market in my preferred Memphis neighborhoods has markedly accelerated in the past few months, with quality homes selling quickly, and often above asking price.
But what about the rental market, and tenants’ ability to pay rent? After all, some of the industries disproportionately impacted by the pandemic (restaurants, bars, hotels, hair salons, and more) employ a lot of the folks who are most likely to be renters.
Well, after six months, the most interesting thing to note is that all my tenants are still current on their rent, despite the severe economic impacts of the pandemic. (This is borne out by my most recent monthly portfolio report.) While we’re by no means out of the woods yet, most landlords I speak to are seeing what I’m seeing: a remarkably stable business, despite everything going on.
Federal assistance through the CARES Act – in the form of $1200 checks, extra benefits for the unemployed, and forgivable loans to small businesses – no doubt helped soften the blow. But even with all that assistance now expired, the vast majority of tenants are still paying rent.
I think this proves the old maxim that rental property investing is relatively recession-proof. Why is this so? Because the demand for housing is extremely inelastic — in other words, everyone needs a place to live, regardless of economic conditions — and because most people will do everything they can to pay their rent, even when they’re in very tough circumstances. Governments also have a strong incentive to keep renters in their homes, as we’ve seen this year, and this serves as another backstop.
For me, then, investing in rental properties makes as much sense now as it did before the pandemic. Which reminds me of another old maxim: the best time to invest in rental properties was 10 years ago, and the second best time is now. So get after it!
(And if you need help with YOUR next property, schedule a free coaching consultation with me. There are no obligations or commitments of any kind, so go ahead and take the first step!)
Annual Updates
For all Property Spotlights, I come back at the end of each year to provide a brief narrative of what happened at the property that year. I also update my annual and cumulative figures for the property, including cash flow, equity growth, and occupancy.
2021
A quiet year, until my tenant vacated unexpectedly in November after just one year due to a personal situation, breaking their lease. Fortunately, the turn was short and relatively inexpensive, and I retained the security deposit due to the lease break — so I still managed to eke out $51 of positive cash flow for the year. (Most of the time, a property that has a turn will lose money for the year.) A new tenant will be in place at a higher rent ($875 vs. $725) at the start of next year, so I’m looking forward to the first full year of stable cash flow at this property in 2022.
2022
Not a peep out of this property all year from the new tenant who moved in last fall on a two-year lease. Zero maintenance expense this year (the joys of turnkey!), allowing me to exceed my cash flow target by over $1K. The tenant is currently at market rent.
2023
Another perfectly quiet year at this house. For the second year in a row, not a single maintenance expense (remarkable), leading to another $1K+ surplus vs. my cash flow expectations. And the tenant has quietly paid their rent on time each month. Their lease is up in February 2024, so hopefully they’ll renew with a small increase.
2024
In the early spring, my PM renewed this excellent tenant on another 2-year lease. Unfortunately, they did this with only a $10/mo increase in rent, to $885/mo. This missed a significant opportunity to raise rents — market rent for this house is now closer to $1,000/mo — and I was pretty disappointed in this result. Still, there are worse things than a tenant who always pays on time, so it wasn’t a huge deal in my book.
After several very quiet years, there was a significant maintenance issue this year: a blockage in the HVAC condensate line that caused some flooding in the house. We had to run a new condensate line through the attic, along with other plumbing costs, which combined to push me below cash flow expectations for the year. I also spent nearly $4K to replace LVP flooring (CapEx) that was damaged by the water.
About the Author
Hi, I’m Eric! I used cash-flowing rental properties to leave my corporate career at age 39. I started Rental Income Advisors in 2020 to help other people achieve their own goals through real estate investing.
My blog focuses on learning & education for new investors, and I make numerous tools & resources available for free, including my industry-leading Rental Property Analyzer.
I also now serve as a coach to dozens of private clients starting their own journeys investing in rental properties, and have helped my clients buy millions of dollars (and counting) in real estate. To chat with me about coaching, schedule a free initial consultation.
