Memphis Rental Property #5

Last updated: 2025
NOTE: All facts and figures were accurate as of the time this article was first published in 2024. The house was bought in 2019. See the Annual Updates section at the end of the post to check out how the property has fared since then.
Say hello to my 5th house in Memphis! Well, in truth this was purchased a week before Property #3 and Property #4 — I was buying houses fast and furious around this time, and would have 16 in my portfolio within four months of this deal closing.
But there are several new and notable things about this house, though. It was the first house I bought that was not a free-standing single family home; instead, this one is a townhouse-style property that shares a wall with another unit. I really like these units as rentals, and I think many tenants do as well — they’re cute, simple, and have limited yard maintenance. Unfortunately, I haven’t yet found the right opportunity to add another townhome to my portfolio, so this is the only one of my properties that looks like this.
Also, this was also the first property I bought from a turnkey provider, as I came to appreciate the benefits of the turnkey model. I went on to buy numerous other turnkey properties in my portfolio — in fact, about 1/3 of properties in own were turnkeys.
Alright, let’s get into the details of this house!
Property #5: The Deal
I bought this house from a turnkey provider. After purchasing my first couple of properties, I visited Memphis to get they lay of the land and meet some of my partners in person. I toured some neighborhoods and properties with this particular provider, and liked their approach to the business. In fact, I actually toured this specific property while the rehab was underway, and decided to go forward with an offer the next day.
As was the case with nearly all my purchases after Properties #1 and #2, I used a mortgage to finance this purchase. (Here’s why.) The rate on this mortgage was 4.95%, pretty consistent with the other mortgages I initiated around this time.
This house was a 3-bedroom with 2 full baths, and was located in handsome-looking subdivision in the 38141 zip code. This is one of the nicer areas in which I own properties — let’s call it a solid B- neighborhood — but prices on these townhomes are still quite reasonable. The entire subdivision has the same style of townhomes, two units for each structure, and they were built in 1993, which makes this one of the younger properties in my portfolio.
Here are some facts about this particular house:
Built in 1993
Central air
1507 square feet of interior space
Full turnkey rehab
Hard-surface flooring except carpet in bedrooms and upstairs to reduce noise
Small yard
The property was offered at $99,500. With turnkey purchases, you generally have to pay list price, which is what I did. We expected to get rent of $950, which would fall just short of the “1% rule”.
Property #5: Due Diligence
With a turnkey purchase, you’re relying on the provider to deliver the product they promised, so it’s normal for the provider to order a 3rd-party inspection, and then provide evidence of any fixes they made in response to the inspection. That’s exactly what happened here, so I was confident I was getting a house in great shape.
Because I was using a mortgage, I also had an appraisal. The appraisal came in low, and $90,000 (compared to purchase price of $99,500). Whenever this happens, you have an opportunity to renegotiate the price with the seller. We agreed to lower the price to $95,000, which I felt was a win for me despite the lower appraisal.
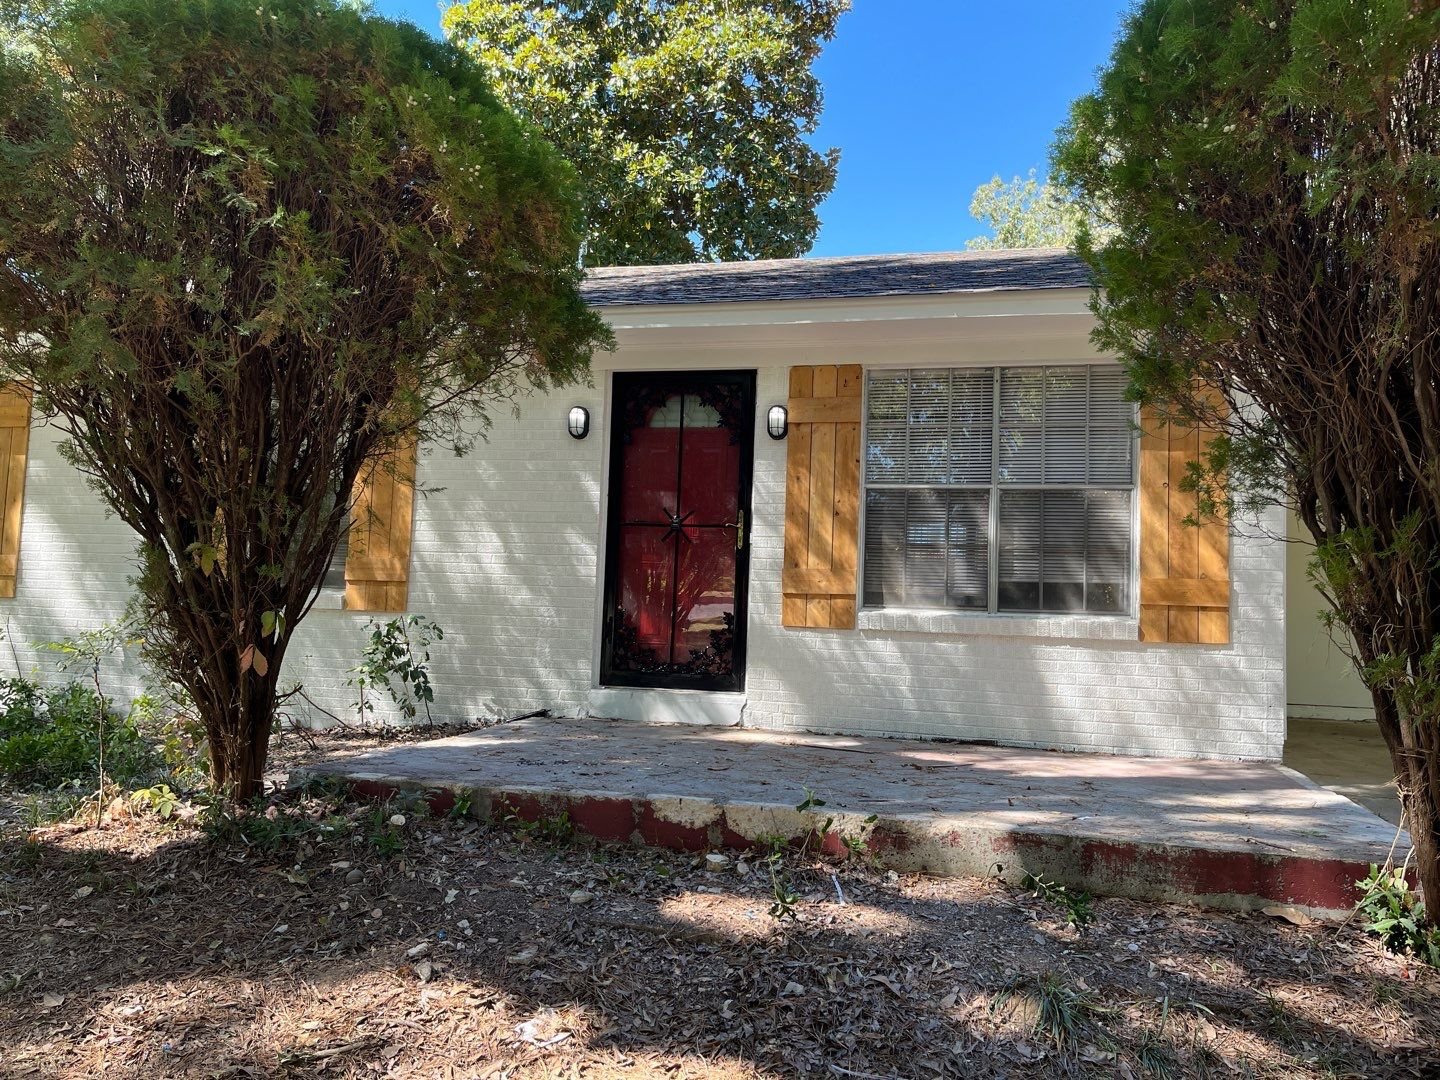
And that was pretty much it for due diligence! Here’s what the finished product looked like when I closed:


Property #5: The Financials
I financed 68% of this purchase with a conventional loan at 4.95%, so my down payment was $30,000, and I incurred $3,218 in closing costs. I used the RIA Property Analyzer to run the final numbers on this property – here are the key metrics that the analyzer calculated for me:

Purchase Price: $95,000
Monthly Rent: $950
Monthly Cash Flow: $265
Cap Rate: 7.71%
Cash on Cash Returns: 9.48%
Total Returns w/ 2% Appreciation: 17.92%
(Want to use this calculator yourself? You can!)
OR
Using the multi-year model in the RIA Property Analyzer, we can visualize some of the main long-term trends, assuming an average inflation rate of 2%:

Cash flow increases over time. This is mostly because rent and expenses are expected to rise with inflation, but one major expense (my mortgage) is fixed.
Cash Flow Year 1: $3,186
Cash Flow Year 10: $4,615
Cash Flow Year 25: $7,642
Mortgage paydown accelerates over time. This is because of the way banks amortize loans – each month, a little bit more of your fixed payment is principal, and a little bit less is interest.
Mortgage Paydown Year 1: $962
Mortgage Paydown Year 10: $1,500
Mortgage Paydown Year 25: $3,147


Total returns on cash increases over time. This is a consequence of the first two graphs – I will make greater total returns over time on the same initial investment of cash.
Total Returns on Cash Year 1: 17.99%
Total Returns on Cash Year 10: 24.94%
Total Returns on Cash Year 25: 41.18%
This is one my favorite properties in my portfolio. It’s a spacious, appealing 3/2 in a good area, and I love the townhome configuration. The fact that it was a full turnkey means I should expect lower maintenance and capex costs out of the gates. And for a fully renovated property, achieving cash-on-cash of over 9% is really strong.
Property #5: The Deal Sheet
Finally, to sum up Property #5 and its financials, here’s the full “deal sheet”:

Looking for YOUR Next Property?
If you need help finding, analyzing, and purchasing YOUR next property — or your first one! — schedule a free initial consultation with me. I’ve helped dozens of private coaching clients invest with confidence and build cash-flowing rental portfolios of their own.
Annual Updates
For all Property Spotlights, I come back at the end of each year to provide a brief narrative of what happened at the property that year. I also update my annual and cumulative figures for the property, including cash flow, equity growth, and occupancy.
2019
The property rented quickly at the expected asking price of $950, and the new tenant moved in a few weeks after I closed. I had a few vacant-property expenses such as lawn-mowing and utilities, along with my PM’s annual occupied inspection, but other than that, it was pretty smooth sailing for the year.
2020
The tenant renewed at $1,003/mo. for another year. Meanwhile, very little happened at the property: the only costs I incurred were my annual inspection and a $177 plumbing repair, so this was VERY smooth. Cash flow $4,800, or $1,300 above my target.
2021
At renewal time, this tenant chose not to sign a new lease, preferring to go onto a month-to-month arrangement. At first I thought this was a sign he planned to vacate, but in hindsight that was not the case. My PM would charge him a $200/mo. fee to go to a MTM arrangement, and we kept working until the end of the year to encourage him to sign a new lease. On the maintenance side, I spent $765 on a roof repair and HVAC maintenance — more than previous years, but still good enough for me to exceed my cash flow target by over $1K.
Like all my properties this year, huge increases in home prices were registered, and my annual equity growth topped $40K.
2022
WIth the tenant more or less refusing to sign a new lease, I made an arrangement with my PM that we would continue charging the $200/mo. fee, but that I would receive that fee as rent (for a total of $1,203/mo.) This is still below market rent given the rapid run-up in rent prices, but the tenant is otherwise ideal — he pays rent on time every month, and takes good care of the property. For that kind of tenant, I’m happy to stay below market rent and avoid a turn.
Once again, maintenance costs were extremely low, under $200 for the year. This property is a perfect example of the benefit of turnkey: very low maintenance expenses, and no capex items at all, in the first several years.
2023
The tenant continued to pay $1,203/mo., and I continued to be satisfied with this despite it being several hundred dollars below market rent. I had an HVAC repair visit this year, but total maintenance costs still came in below $500, and I exceeded my cash flow target by over $2K — the fourth year in a row I came in above target.
2024
The tenant continued with their month-to-month arrangement at $1,203/mo., but in December, they finally decided to vacate. The turn scope included paint, some plumbing items, landscaping, and other miscellany. I also made some capital improvements, including new LVP flooring to replace the carpeted bedrooms, a new water heater, and new storm doors. All told, the maintenance cost was over $5K, plus another $5K in CapEx. Not cheap.
Thanks to these turn costs, my cash flow was negligible for the year. But my cumulative cash flow vs. target is still in the green by over $2,500, thanks to excellent numbers in the preceding years. Plus, I should be able to place a new tenant at over $1400/mo., which should set me up for even better cash flow in the years to come.


About the Author
Hi, I’m Eric! I used cash-flowing rental properties to leave my corporate career at age 39. I started Rental Income Advisors in 2020 to help other people achieve their own goals through real estate investing.
My blog focuses on learning & education for new investors, and I make numerous tools & resources available for free, including my industry-leading Rental Property Analyzer.
I also now serve as a coach to dozens of private clients starting their own journeys investing in rental properties, and have helped my clients buy millions of dollars (and counting) in real estate. To chat with me about coaching, schedule a free initial consultation.