Memphis Rental Property #4

Last updated: 2026
NOTE: All figures and statements in this article were accurate as of the time of initial publication in 2024. I purchased this house in 2019. Check out the Annual Updates section at the bottom of the post to see how the property has performed since then.
This house is a close cousin of Property #3: they’re in the same neighborhood; I bought both houses from the same seller; and I closed on them on the same day (along with three others).
As I mentioned in the intro to Property #3, this was during the period of rapid acquisitions at the beginning of my remote investing journey, during which I bought 16 houses in 9 months. In fact, properties #3 through #16 were bought in a span of 120 days, and those are the properties I’m now going back to “fill in” so that I have a Property Spotlight for each of my houses.
With that context set, let’s get into the details of this investment property!
Property #4: The Deal
This house and Property #3 were purchased from the same seller, who had recently rehabbed both properties and placed new tenants. I liked that the properties looked nice and had new finishes, but the seller was not a turnkey operator I recognized. Were I buying these houses today, I would have asked a lot more questions, and been more sensitive to the risks associated with buying from an unknown flipper. I also would have paid more attention to the details of the rehabs themselves, since it turns out that the roofs had not been replaced, among other things. Therefore, they weren’t true turnkey rehabs, and I therefore should have thought about their value differently. (Live and learn!)
Despite many similarities, this house was different from Property #3 in a few respects:
2 full baths instead of 1.5 baths
On a main drag instead of side street
Even less curb appeal (neither are great in that respect)
As was the case with nearly all my purchases after Properties #1 and #2, I used a mortgage to finance this purchase. (Here’s why.) The rate on this mortgage, just like Property #3, was 4.93%. (Can’t get those rates today!)
I bought this house off Roofstock. At the time, Roofstock was a new platform with some unique advantages: all exclusive listings that couldn’t be found elsewhere; helpful financial analysis tools built into the listing pages; due diligence already provided, including inspections and tenant ledgers; and the ability to make offers directly through the platform to the seller, without using an agent. Unfortunately, all of those aspects of Roofstock have since changed — it is now just an MLS listing aggregator trying to make money through agent referrals. As a result, I don’t recommend Roofstock to my private coaching clients anymore, as it doesn’t offer any incremental benefit to shopping for properties on Zillow.
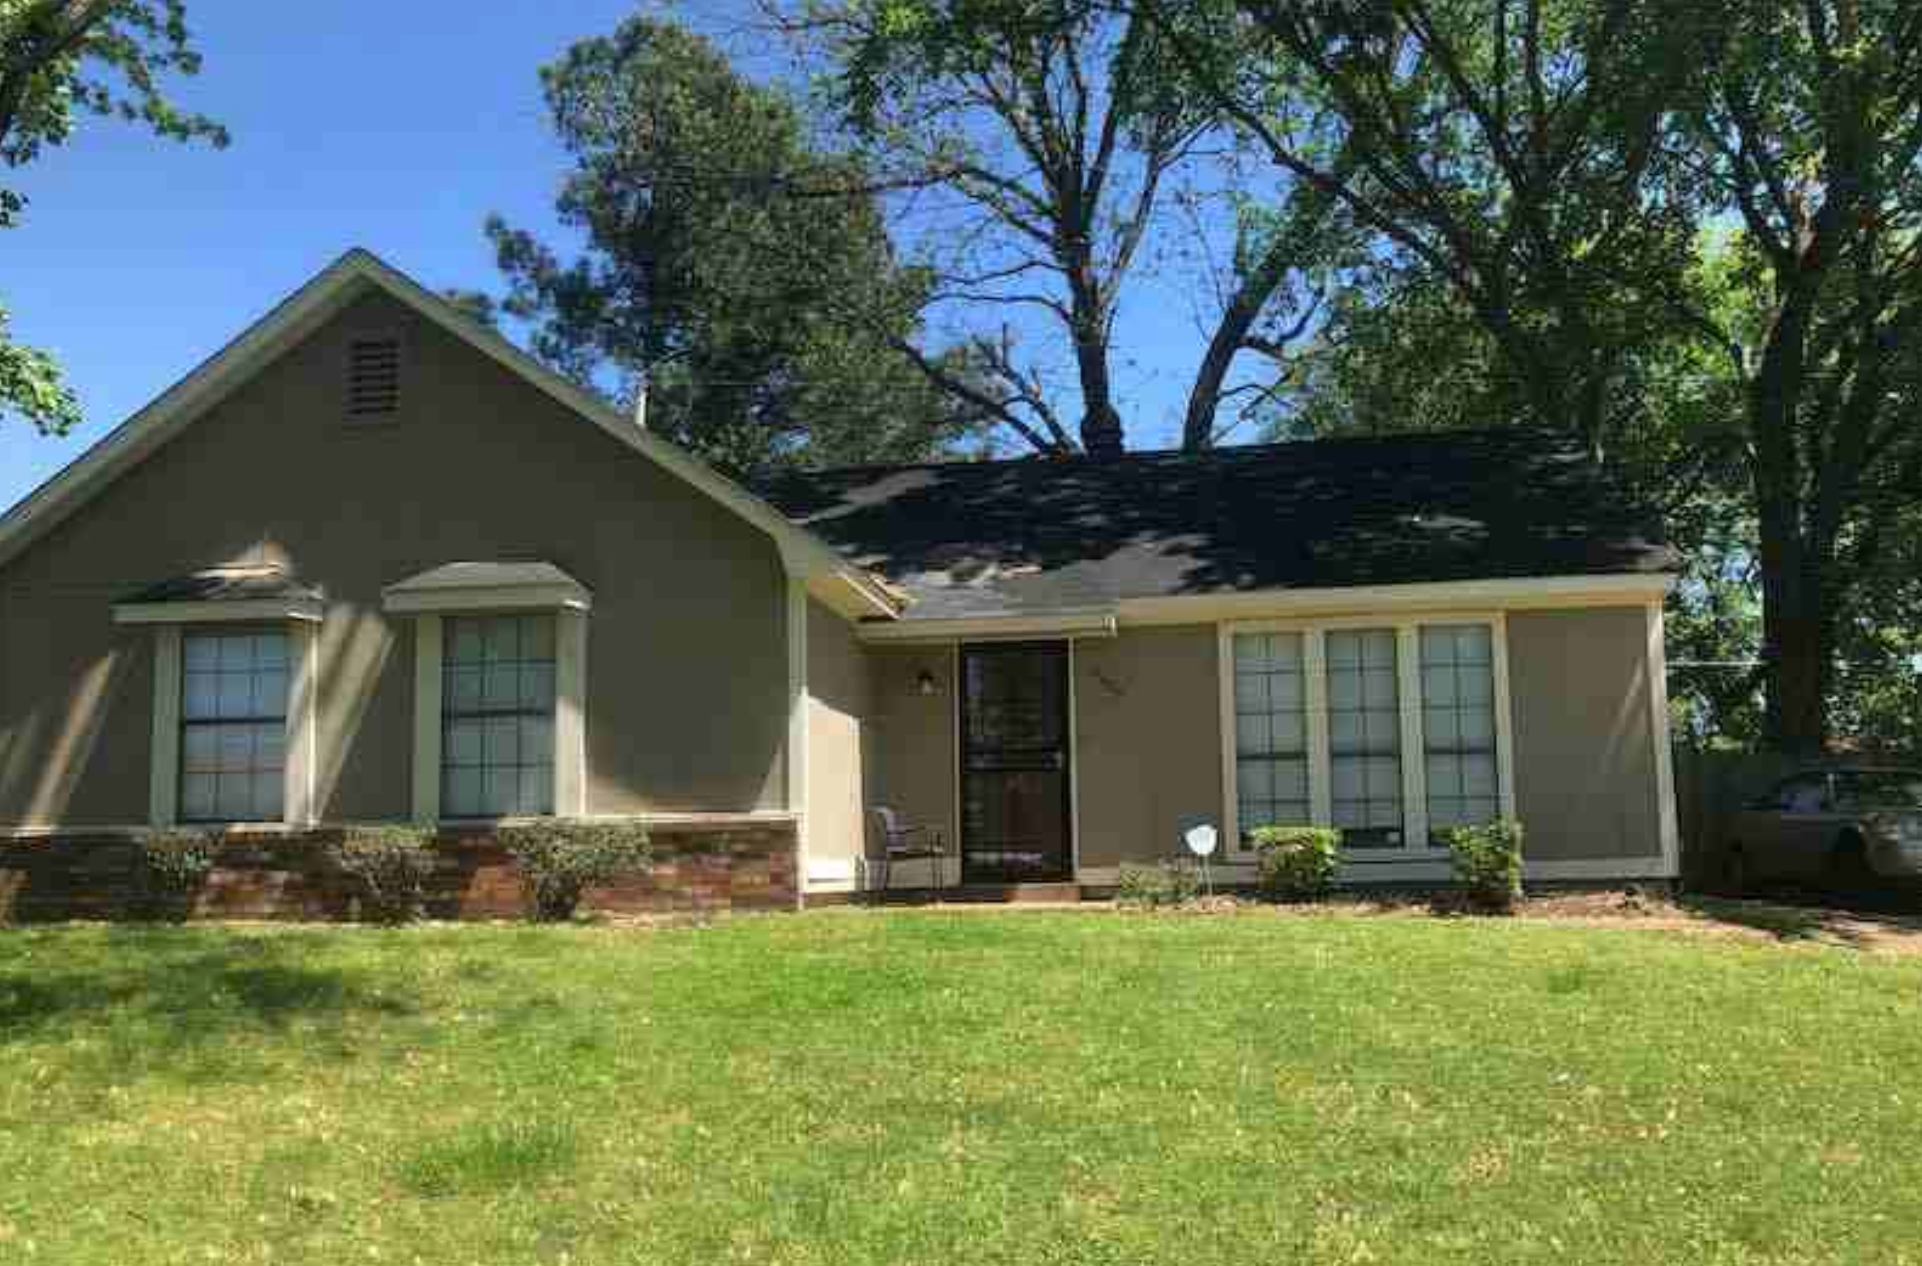
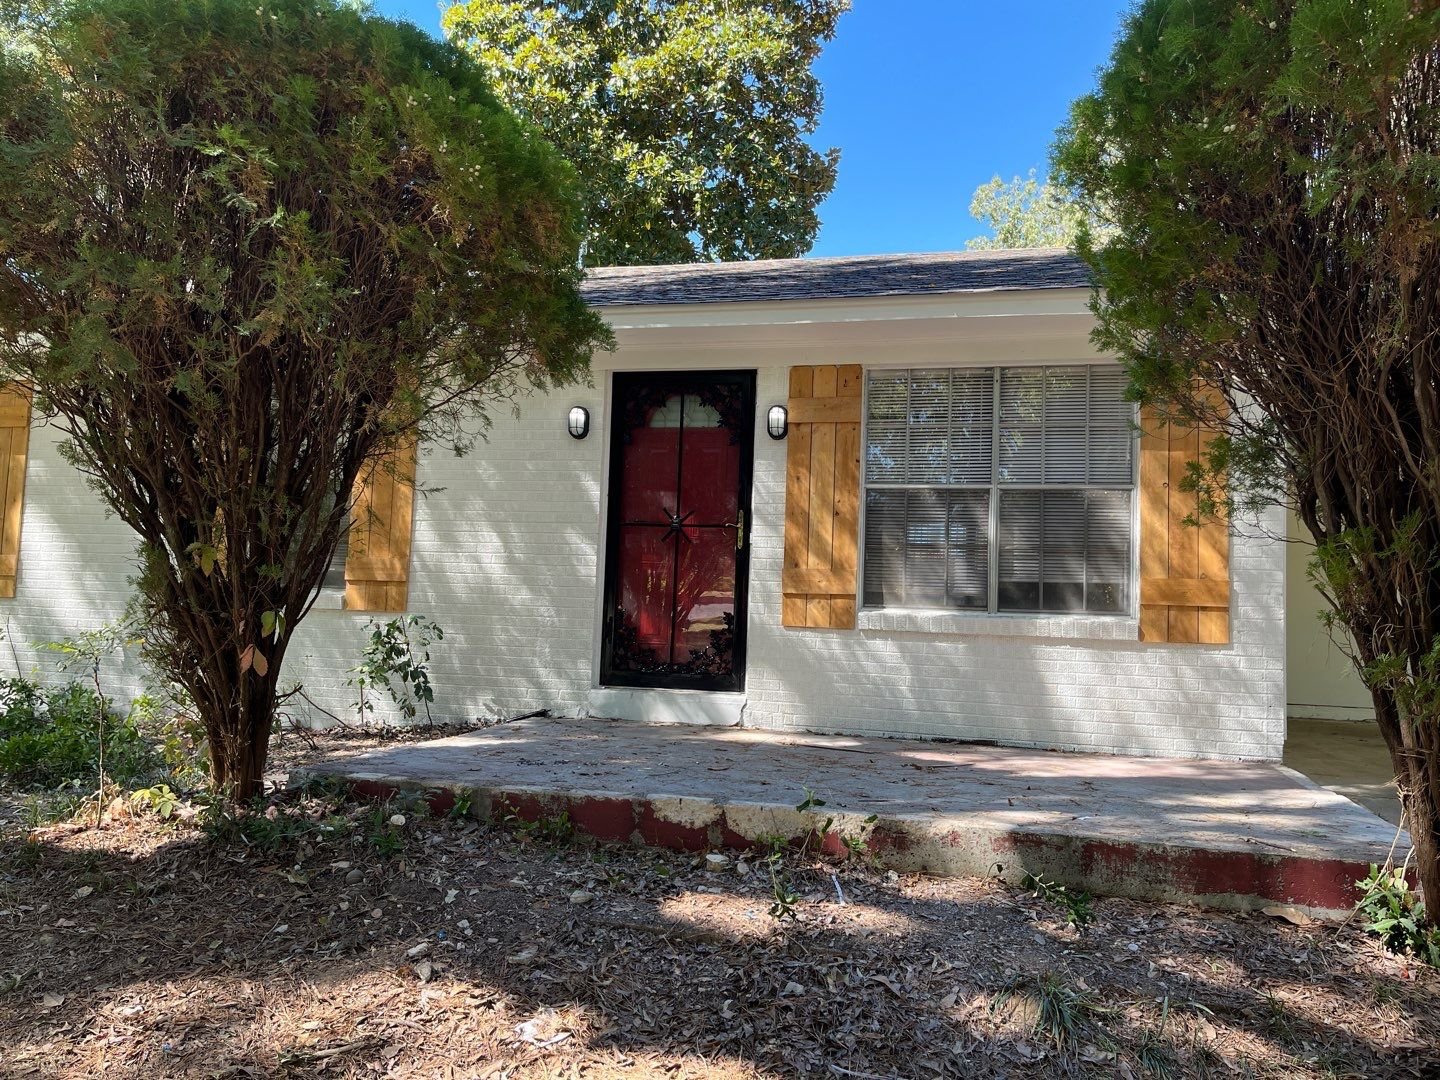
Anyway, this house was a 3-bedroom with 2 full baths, and was located in the Parkway Village neighborhood. This is a very solid C/C+ area, with most homes built in the 1950’s-1970’s, and it has become one of my favorite investment neighborhoods in Memphis. Here are some facts about this particular house:
Built in 1958
Central air
1288 square feet of interior space
Recent rehab with fresh paint & finishes
Hard-surface flooring except carpet in bedrooms
New tenant in place at $895
The property was offered at $84,900. My original offer was for $70,000. After several rounds of counter-offers, the seller agreed to a purchase price of $79,000. I signed the paperwork and we headed into the due diligence phase of the deal.
Property #4: Due Diligence
As mentioned, Roofstock provided an inspection document upfront, which looked very clean. The tenant had just been placed, so there was no payment history to review. However, I did know the tenant had been placed by a large, reputable PM, so I was confident that the screening standards used were reasonable.
Because I was using a mortgage, I also had an appraisal, which came in at $80,000, just slightly above the purchase price of $79,000.
And that was pretty much it for due diligence! When you can see an inspection report before you make your offer, the due diligence phase becomes very easy. It was one of the really nice things about the old Roofstock before they made all those changes. (RIP, old Roofstock.)
Here are some photos of the property so you can get an idea what it looks like (note that these are taken a few years later, after I replaced the bedroom carpet with LVP):


Property #4: The Financials
I financed 68% of this purchase with a conventional loan at 4.93%, so my down payment was $25,000, and I incurred $2,802 in closing costs. I used the RIA Property Analyzer to run the final numbers on this property – here are the key metrics that the analyzer calculated for me:

Purchase Price: $79,000
Monthly Rent: $895
Monthly Cash Flow: $275
Cap Rate: 8.53%
Cash on Cash Returns: 11.78%
Total Returns w/ 2% Appreciation: 20.20%
(Want to use this calculator yourself? You can!)
OR
Using the multi-year model in the RIA Property Analyzer, we can visualize some of the main long-term trends, assuming an average inflation rate of 2%:

Cash flow increases over time. This is mostly because rent and expenses are expected to rise with inflation, but one major expense (my mortgage) is fixed.
Cash Flow Year 1: $3,308
Cash Flow Year 10: $4,623
Cash Flow Year 25: $7,409
Mortgage paydown accelerates over time. This is because of the way banks amortize loans – each month, a little bit more of your fixed payment is principal, and a little bit less is interest.
Mortgage Paydown Year 1: $803
Mortgage Paydown Year 10: $1,250
Mortgage Paydown Year 25: $2,613


Total returns on cash increases over time. This is a consequence of the first two graphs – I will make greater total returns over time on the same initial investment of cash.
Total Returns on Cash Year 1: 20.27%
Total Returns on Cash Year 10: 27.64%
Total Returns on Cash Year 25: 44.74%
Overall, this was an excellent cash flow property. I was able to achieve nearly 12% cash-on-cash returns, which even at the time of purchase was great. Like Property #3, it’s in a good area, and I think I got a slightly better deal on this house compared to Property #3 — that second full bathroom is valuable for rent potential, and I didn’t pay much more for it in the price of the home.
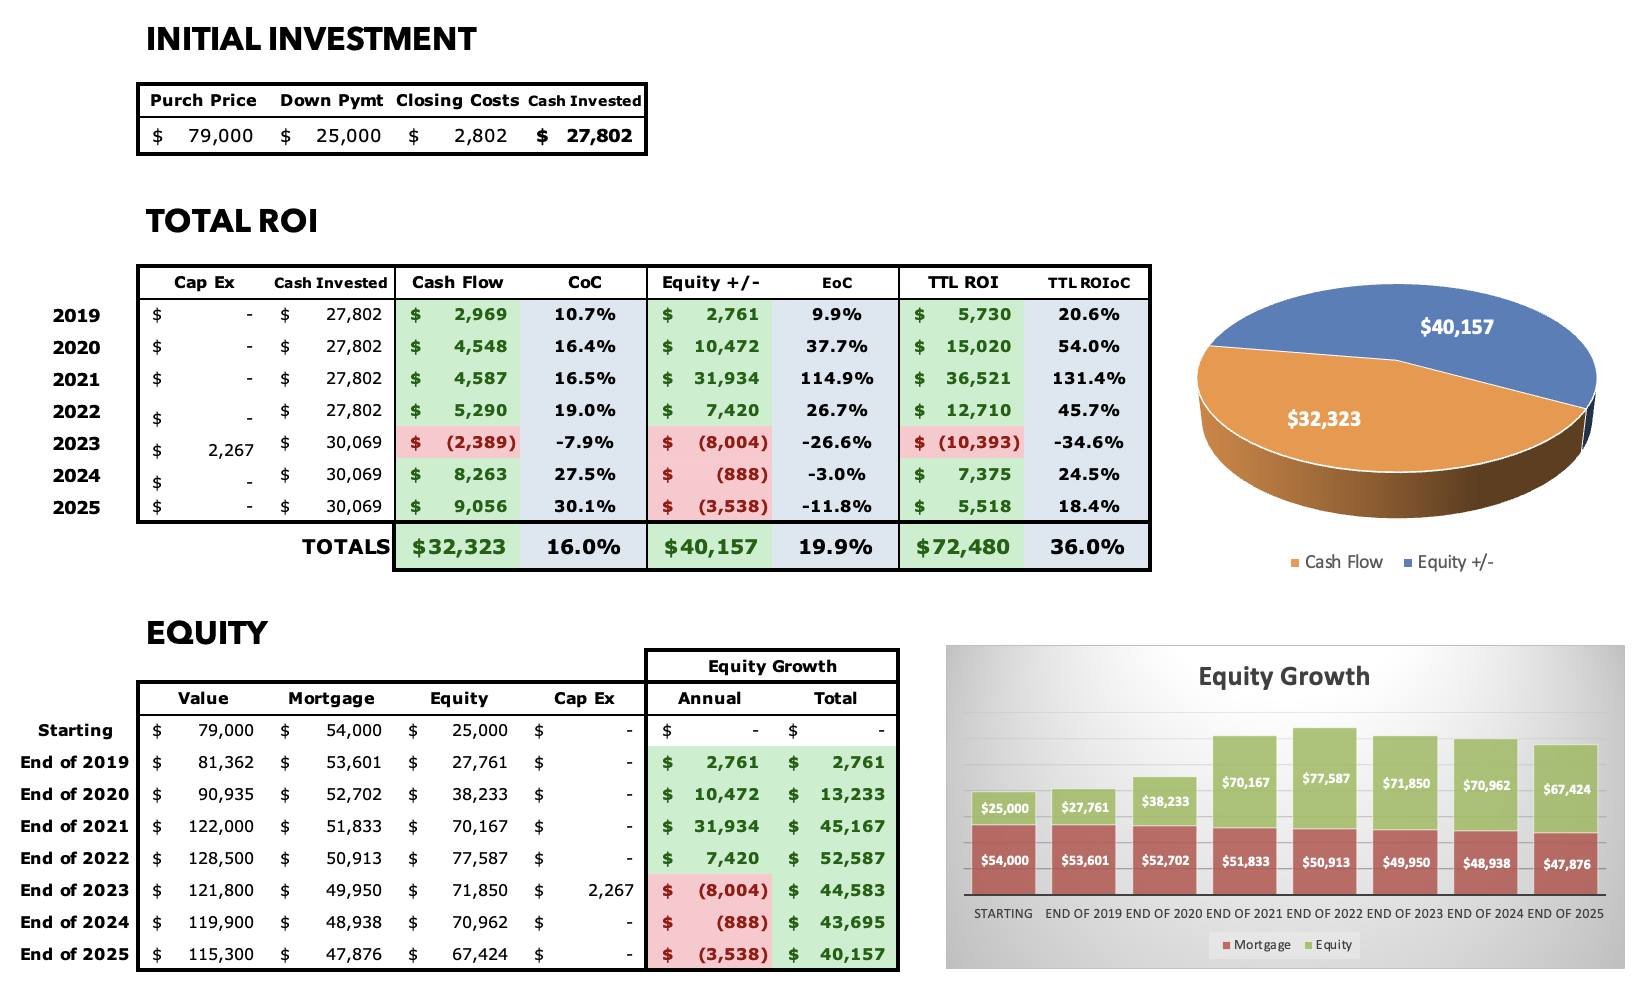
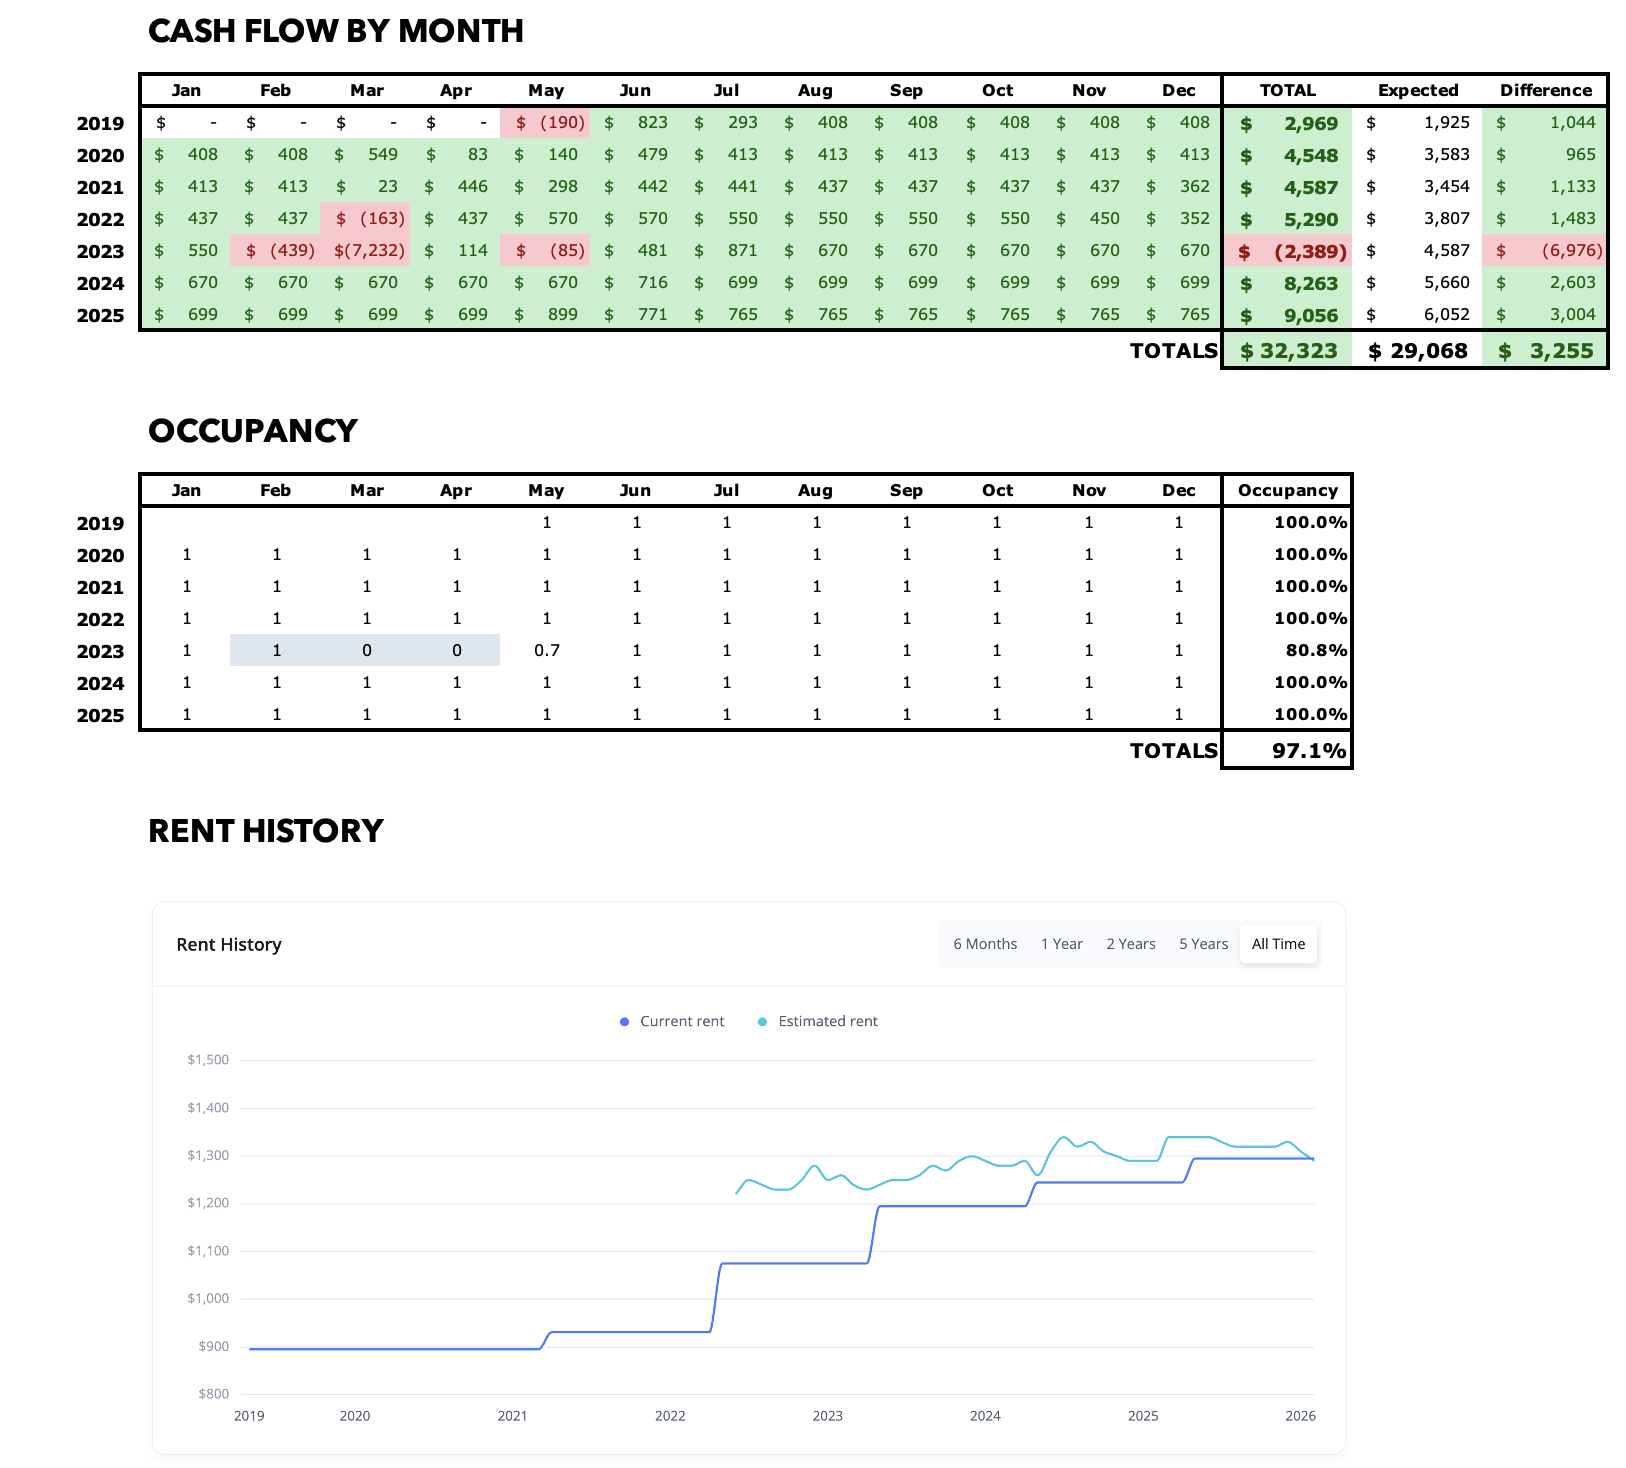
Property #4: The Deal Sheet
Finally, to sum up Property #4 and its financials, here’s the full “deal sheet”:

Looking for YOUR Next Property?
If you need help finding, analyzing, and purchasing YOUR next property — or your first one! — schedule a free initial consultation with me. I’ve helped dozens of private coaching clients invest with confidence and build cash-flowing rental portfolios of their own.
Annual Updates
For all Property Spotlights, I come back at the end of each year to provide a brief narrative of what happened at the property that year. I also update my annual and cumulative figures for the property, including cash flow, equity growth, and occupancy.
2019
Because the property was occupied, I was able to cash flow from Day 1. Other than my PM’s annual occupied home inspection, there were no expenses at all, allowing me to surpass my expected cash flow by more than $1,000.
2020
The tenant’s initial lease was for 2 years, so there was no renewal in 2020. I had a few minor maintenance issues, mostly with the electrical, but in total the repairs were less than $600 — less than budgeted, so I again exceeded my cash flow target.
2021
The tenant renewed their lease at the beginning of the year, with an increase to $931/mo. It was another quiet year for ongoing maintenance, with costs again ~$600, so I once again exceeded my cash flow target by more than $1,000. Like all my properties, appreciation was very strong this year as well — this house gained about 30% in value this year, according to the Zestimate.
2022
With rents rising rapidly, we asked for a much larger increase in rent on the tenant’s renewal this year. They signed on for another year at $1,075/mo. The tenant’s payment history was decent, but they did frequently pay late. I had a $600 expense to remove some fallen limbs after a storm, but expenses were otherwise low, so the property produced over $5K in cash flow, nearly $1,500 ahead of my target (the big rent increase helped with that differential quite a bit.)
2023
In February, the tenant turned in their keys several months before the end of their lease, saying they could no longer afford the rent. They had been paying late every month, so this was not a shock — and this route is much preferable to having to go through an eviction. Still, the turn (my first at this property) was pretty expensive, as the tenant left it quite a mess. I also invested $2K+ in new flooring to replace the carpet in the bedrooms. I retained the $895 security deposit due to the lease break, and a new tenant was placed at a higher rent of $1,195/mo., but nevertheless the cost of the turn brought my cash flow into the red for the year by more than $2K.
2024
After a tough year in 2023, things stabilized nicely this year. The new tenant nearly always pays on time, and renewed for another year with an increase to $1,245.
Plus, there were $0 in maintenance expenses and $0 CapEx this year (not even an occupied home inspection, somehow.) So this led to a red-hot year for cash flow: profit was over $8K, exceeding my pro forma by over $2,500.
Like most of my properties, home values have been more or less stable the last few years.
2025
For the second straight year, operations were exceedingly smooth at this property, with no maintenance costs. Annual cash flow was over $9K, which beat target by over $3K.
The tenant renewed for another year at $1,295/mo., which brings them in line with market rent.
About the Author
Hi, I’m Eric! I used cash-flowing rental properties to leave my corporate career at age 39. I started Rental Income Advisors in 2020 to help other people achieve their own goals through real estate investing.
My blog focuses on learning & education for new investors, and I make numerous tools & resources available for free, including my industry-leading Rental Property Analyzer.
I also now serve as a coach to dozens of private clients starting their own journeys investing in rental properties, and have helped my clients buy millions of dollars (and counting) in real estate. To chat with me about coaching, schedule a free initial consultation.