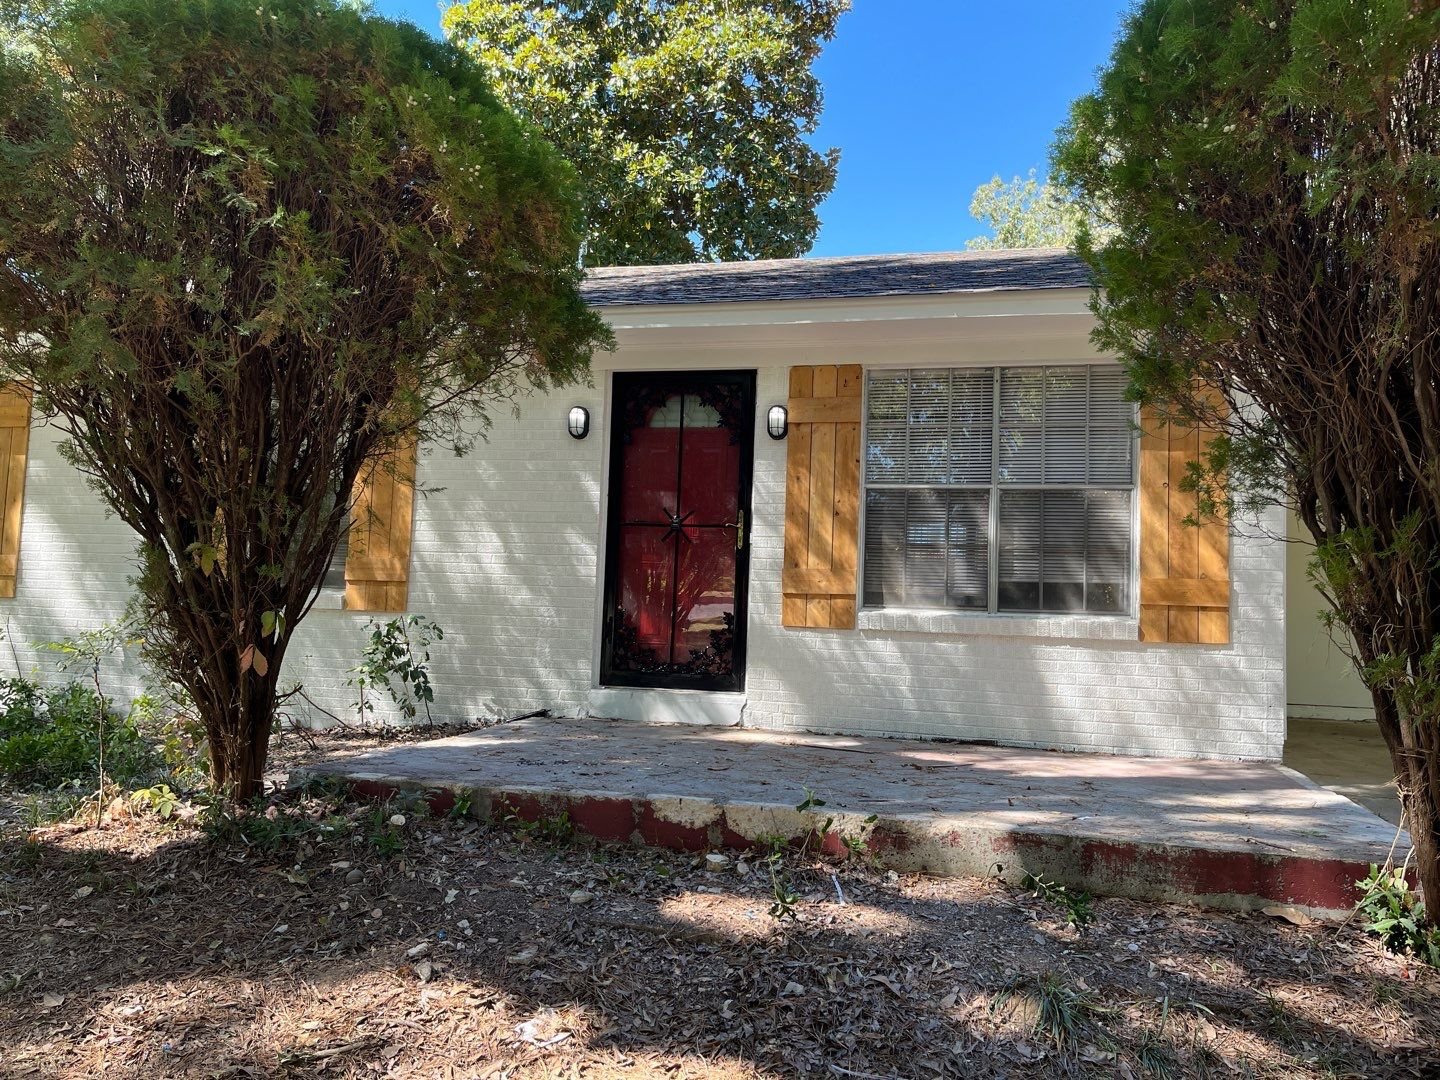
Memphis Rental Property #2
Last updated: 2025
NOTE: All figures and statements in this article were accurate as of the time of initial publication in 2024. I purchased this house in 2019. Check out the Annual Updates section at the bottom of the post to see how the property has performed since then.
One of my first articles on this blog described the details of my first Memphis rental property, which I bought in 2018. Over the next nine months, I purchased 15 more, primarily using the proceeds from the sale of my primary residence. After that, I scaled my portfolio incrementally over the years, and I created “Property Spotlights” for each of those new properties as I purchased them, the last one being Property #25.
Thus, I ended up in a situation where my first property, as well as properties #17 through #25, had detailed blog articles about them. But it always bugged me that properties #2 through #16 were missing, and I figured one day I’d go back and fill in the gaps. Naturally, “one day” turned into many years. But I’m finally diving into this process, starting with Property #2, and I’m committed them all done in the next year.
Here goes! Let’s get into the details of this deal.
Property #2: The Deal
This was my second ever purchase in the Memphis market. Like my first property, I bought it in cash. At the time, I didn’t appreciate the power of mortgages to amplify the ROI of rental properties, and figured that owning in cash was the best way to maximize cash flow. Shortly thereafter, I ran the numbers more carefully and realized that this was wrong — and later wrote a full article about how mortgages supercharge your returns, so you don’t have to make the same mistakes I made!
Unlike my first property, however, I never went back to do a cashout refi — I still own this property outright, as I do four properties out of my current portfolio of 25. I like it this way, because not being maximally leveraged provides a nice cash flow cushion.
I bought this house off Roofstock. At the time, Roofstock was a new platform with some unique advantages: all exclusive listings that couldn’t be found elsewhere; helpful financial analysis tools built into the listing pages; due diligence already provided, including inspections and tenant ledgers; and the ability to make offers directly through the platform to the seller, without using an agent. Unfortunately, all of those aspects of Roofstock have since changed — it is now just an MLS listing aggregator trying to make money through agent referrals. As a result, I don’t recommend Roofstock to my private coaching clients anymore, as it doesn’t offer any incremental benefit to shopping for properties on Zillow.
Anyway, the house was a 3/1 in central Frayser, which is the quintessential C neighborhood in Memphis. It was vacant, and listed at $59,900. I liked that it was a corner lot with a large backyard, and across from a school. It was a 1950’s era home, with solid brick construction.
It had been listed for a while, so I made a cash offer at $48,000. The seller countered at $52K, I upped my offer to $50K, and the seller agreed. (This was the pre-pandemic era, before the big run-up in home prices we saw from 2020-2022. Can’t get a house like this for $50K anymore!)
Property #2: Due Diligence
As mentioned, Roofstock provided an inspection document upfront, which looked very clean. The home had recently been rehabbed — it had been purchased for $20,000 a few months prior. Everything looked ready-to-rent.
There was no tenant in place, so lease and ledger were not applicable.
The only other piece of due diligence I did was to ask for the scope of work for the rehab. This checked out as expected: the SOW included a full interior rehab, including new LVP floors, full interior paint, new kitchen & bathroom finishes, and various miscellaneous items. They had also installed a new electrical panel & breakers, but the other larger cost areas (roof, HVAC, furnace) had NOT been replaced. Still, I felt that $50K was a fair price for the house, and proceeded to close.
Property #2: Placing a Tenant
There was no rehab to do on this property, so after closing, my PM moved directly into the process of placing a tenant. We originally listed the property for $750.
There was a bit of confusion, though, because my PM heard from the previous PM that there was already a Section 8 applicant approved. We spent several weeks attempting to schedule the Section 8 inspection with the Memphis Housing Authority, only to realize at the end of the process that the tenant’s voucher only entitled them to a 2-BR home, not a 3-BR.
This cost us a bit of time, and we had to lower the price to $695 a few weeks later, with a promotion offering 50% off the first month’s rent. My PM had a signed lease a few weeks later.
I don’t have a lot of great photos for this house, but here are a few from the inspection report just to get the idea:
Property #2: The Financials
This was a cash purchase, so I invested the full $50K into the deal, plus my closing costs ($1,142 — very low because there was no loan) for a total of $51,142 invested. I used the RIA Property Analyzer to run the final numbers on this property – here are the key metrics that the analyzer calculated for me:
Purchase Price: $50,000
Monthly Rent: $695
Monthly Cash Flow: $444
Cap Rate: 10.66%
Cash on Cash Returns: 10.42%
Total Returns w/ 2% Appreciation: 12.38%
(Want to use this calculator yourself? You can!)
OR
Using the multi-year model in the RIA Property Analyzer, we can visualize some of the main long-term trends assuming a long-term inflation rate of 2%. Some of these trends are noticeably different from other Property Spotlights due to the fact that there is no mortgage on this property:
Cash flow increases over time. Both rent and expenses are projected to increase with inflation, but the gap between the two still grows each year:
Cash Flow Year 1: $5,330
Cash Flow Year 10: $6,370
Cash Flow Year 25: $8,573
Without leverage, total returns are lower, but the vast majority of the returns are in the form of cash flow. The only other form of returns are appreciation, which are a much smaller portion:
Appreciation Year 1: $1,000
Appreciation Year 10: $1,195
Appreciation Year 25: $1,608
Total returns on cash increases over time. This is a consequence of the first two graphs – I will make greater total returns over time on the same initial investment of cash. But total returns on equity remains flat.
Total Returns on Cash Year 1: 12.3%
Total Returns on Cash Year 10: 14.7%
Total Returns on Cash Year 25: 19.9%
Overall, this was a strong cash flow play. It wasn’t the nicest property, nor was it in the nicest neighborhood. But it’s good enough to attract stable tenants over time, and the cash flow characteristics are very strong — anything over 10% cash-on-cash returns is a big win, which was true even back in 2019.
Property #2: The Deal Sheet
Finally, to sum up Property #2 and its financials, here’s the full “deal sheet”:
Looking for YOUR Next Property?
If you need help finding, analyzing, and purchasing YOUR next property — or your first one! — schedule a free initial consultation with me. I’ve helped dozens of private coaching clients invest with confidence and build cash-flowing rental portfolios of their own.
Annual Updates
For all Property Spotlights, I come back at the end of each year to provide a brief narrative of what happened at the property that year. I also update my annual and cumulative figures for the property, including cash flow, equity growth, and occupancy.
2019
As discussed above, it took a bit of time to get the initial tenant placed, but by March the first tenant had moved in. There were some maintenance issues in the first few months, but the property was stable after that. Cash flow for the year exceeded $3K, which isn’t too bad for the first year of a property.
2020
Nothing much to report this year. The tenant renewed their lease, and there were very few maintenance costs at the property, allowing me to exceed my cash flow target.
2021
Unfortunately, we were forced to evict the tenant starting in March due to nonpayment. This first turn cost me just over $5K, and we didn’t have a new tenant in place until August. The only good news was that the new tenant is paying $825 compared to the old rent of $695. Still, cash flow for the year was negative, which was a huge miss against my pro forma. (Since I don’t carry a mortgage on this house, cash flow is projected to be quite strong.)
2022
It was nearly a perfect year at this property. The new tenant pays their rent on time religiously, and renewed their lease for another year at $873 per month. Also, there were almost no maintenance costs at the property, so cash flow exceeded my target by nearly $1K.
2023
This year looked just like last year: the tenant is still great, and renewed again at $910/mo; and maintenance costs were non-existent. So my cash flow was very strong — however, I did have two different CapEx items this year. In January, I replaced the roof, and later in the year, I replaced the subfloor and LVP flooring in one room due to some buckling that was occurring. The root cause of that flooring issue is still not 100% clear, and it’s still very possible that other areas of the house will be similarly impacted in the future.
With the addition of these CapEx costs, I now have over $60K invested into this property. Luckily, like the rest of my properties in the last few years, it has appreciated in value rapidly, and is now worth ~$100K.
2024
The tenant renewed for another year at $950/mo., and continues to have a perfect payment record.
Maintenance costs were well in line, with only $1K in total costs. Most of that was to repair some fascia/soffit along the roofline that was beginning to rot. However, I did continue (and hopefully finish) the CapEx work from 2023, by replacing the LVP in both the main living areas of the house that was also buckling. No subfloor work was required, so this work cost only ~$3K.
Thanks to lower maintenance costs, cash flow was nearly $7,700, exceeding my target by almost $1K. Hopefully we’re done with the CapEx for now!
About the Author
Hi, I’m Eric! I used cash-flowing rental properties to leave my corporate career at age 39. I started Rental Income Advisors in 2020 to help other people achieve their own goals through real estate investing.
My blog focuses on learning & education for new investors, and I make numerous tools & resources available for free, including my industry-leading Rental Property Analyzer.
I also now serve as a coach to dozens of private clients starting their own journeys investing in rental properties, and have helped my clients buy millions of dollars (and counting) in real estate. To chat with me about coaching, schedule a free initial consultation.


