Monthly Portfolio Report: January 2022
One of my goals with Rental Income Advisors is to be as transparent and data-driven as possible with my readers and my coaching clients. I think the best way to build confidence in a new investor is to actually show the numbers, to prove that rental property investing really does work as advertised.
For those reasons, I publish a monthly report on my portfolio’s performance. I hope that this chronological history paints a clear picture of what it’s like to be a remote landlord. It’s also a great exercise for me to be sure I’m staying plugged in to all my numbers.
Here is the update for January 2022. You can also check out all my previous monthly reports.
Property Overview
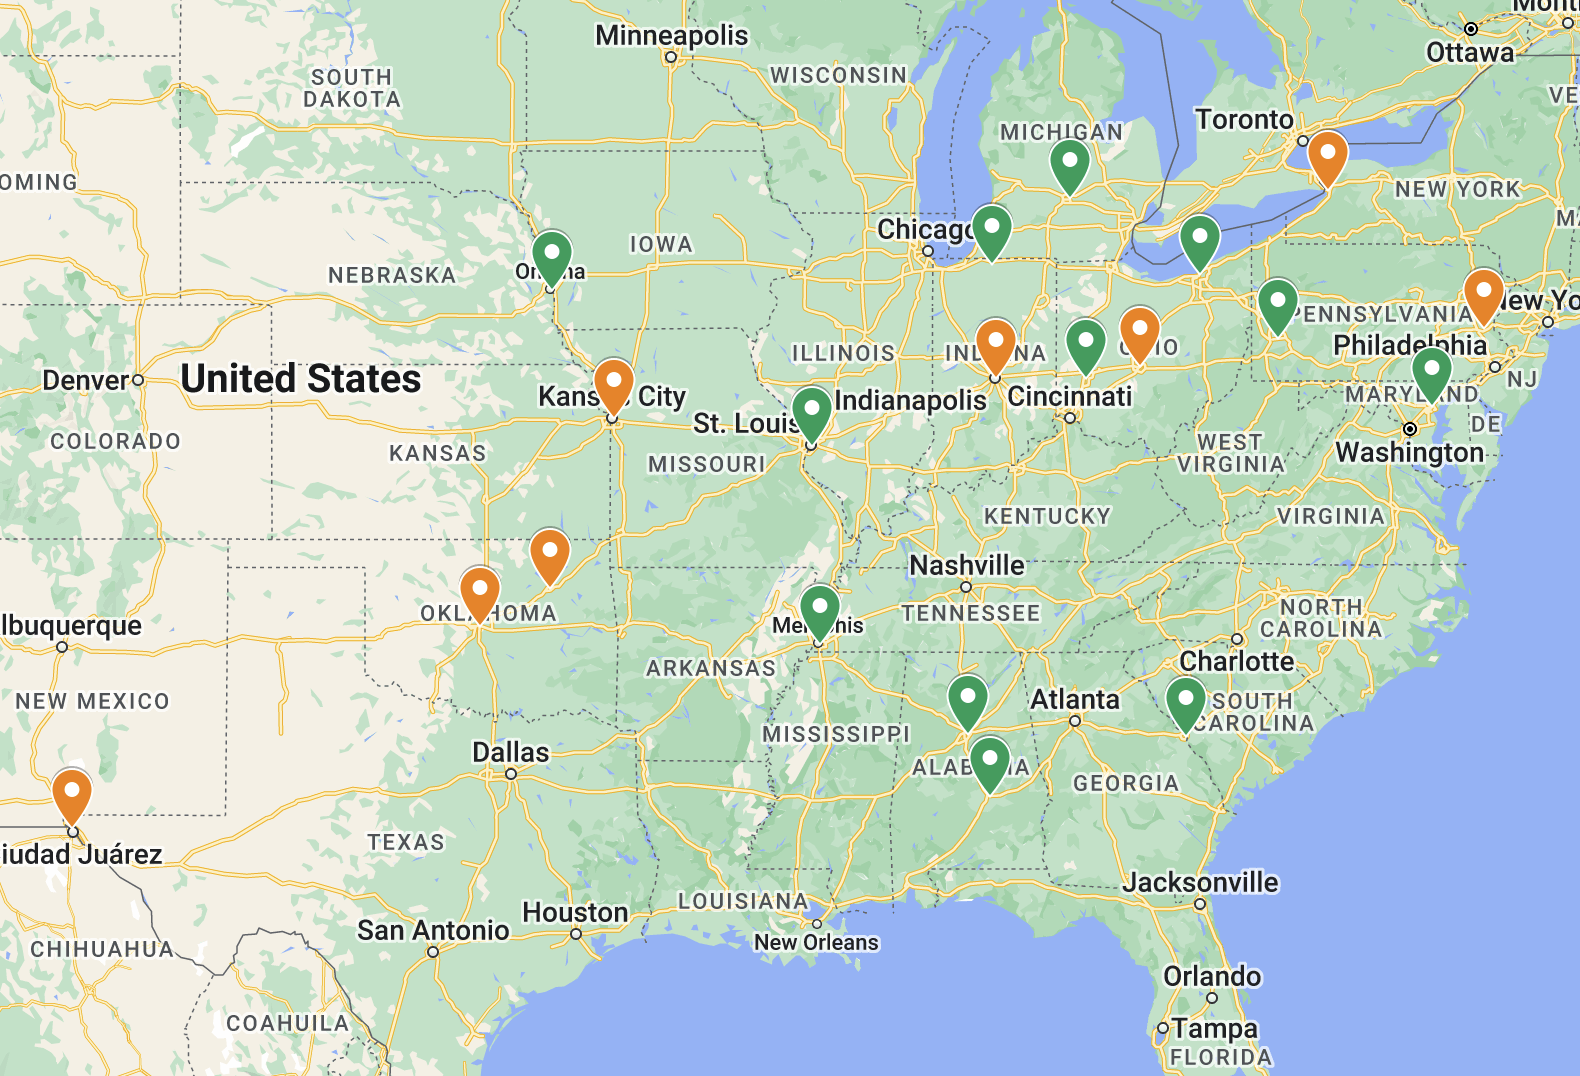
Back to full occupancy to start the year. Woohoo!
Unfortunately, one of those tenants is not paying rent, due to an ongoing eviction. Boohoo!
Rents
The tenant at Property #9 has continued to be delinquent on their rent, and the eviction is still proceeding — but no word yet on a court date.
Somewhat offsetting that shortage were two other factors:
I received back-rent from my Section 8 property, an administrative issue I discussed in last month’s report.
One of my tenants has decided not to renew their lease, and instead stay in their home on a month-to-month basis. To discourage this, my PM charges a $200/mo. fee, which they split with me. So I’ll get an additional $100/mo. on this house while the tenant is month-to-month. I’ve added a new income category in my books for this income, as you’ll see below.
Expenses
Not much to say about my expenses this month, because almost nothing happened (which we love!) Just my normal PM fees, plus:
Maintenance & Repairs: Just one occupied home inspection, and an electrical repair. the turn at .
Utilities: Final utility bills for the turns at Property #19 and Property #17, respectively.
The Bottom Line
My financial model currently projects my Memphis portfolio to generate $6,217 of positive cash flow in an average month. This month, the positive cash flow was $8,649, nearly $2,500 above target. This was due to relatively strong occupancy and collections vs. my pro forma, and to very low maintenance expenses. Great way to start the year! (I wish I could say it continued into February and March, but alas — I suppose reversion to the mean is inevitable.)
Finally, here’s the running tally and graph I update each month. The dotted blue line indicates my projected average monthly cash flow for my portfolio in each given month. January 2022 was a nice start to the year, and my cumulative total since I began these reports in April 2020 is now very close — remarkably close, in fact — to the cumulative projections:
Free Rental Property Analyzer
Need help running the numbers on rental properties? Want to be more confident in your financial projections?
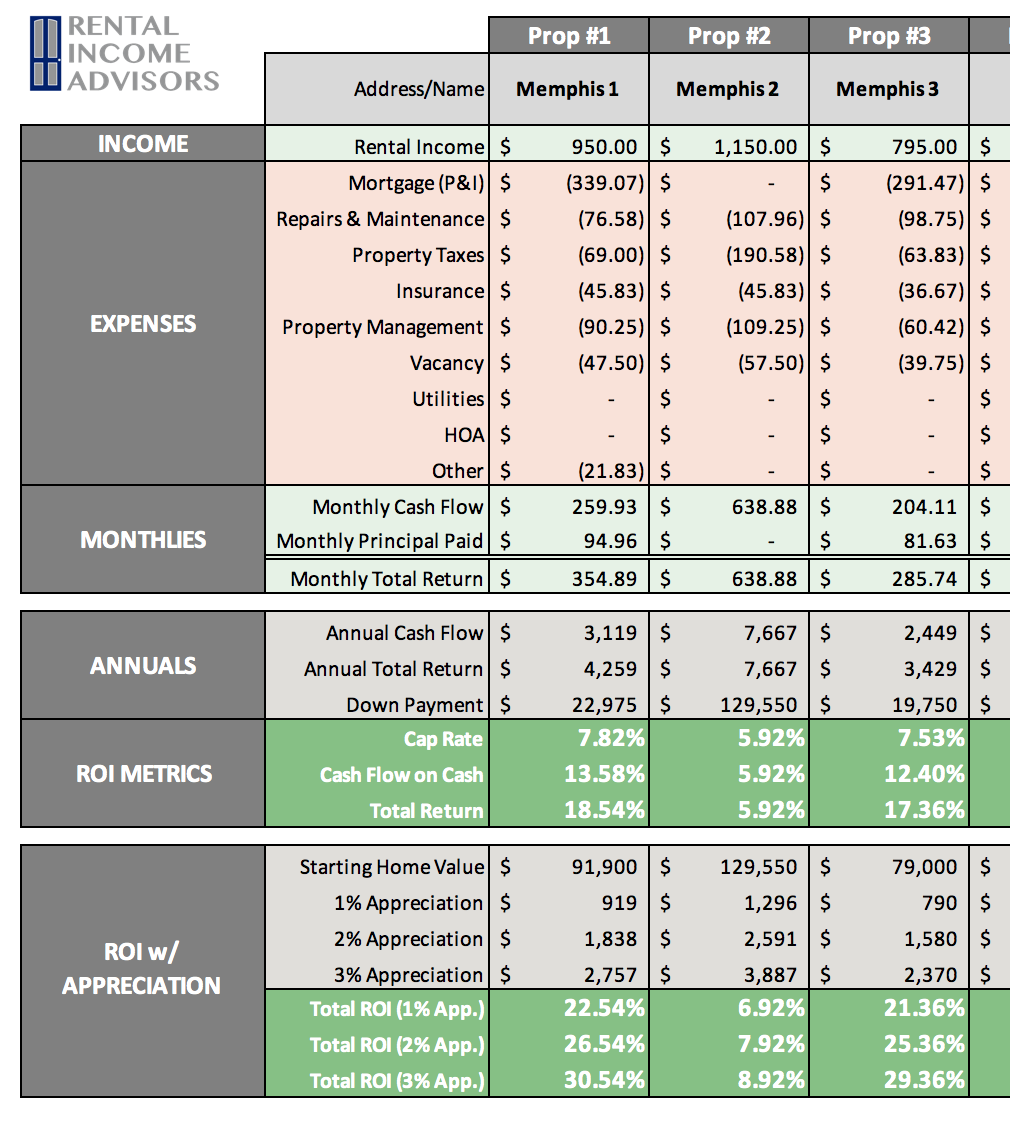
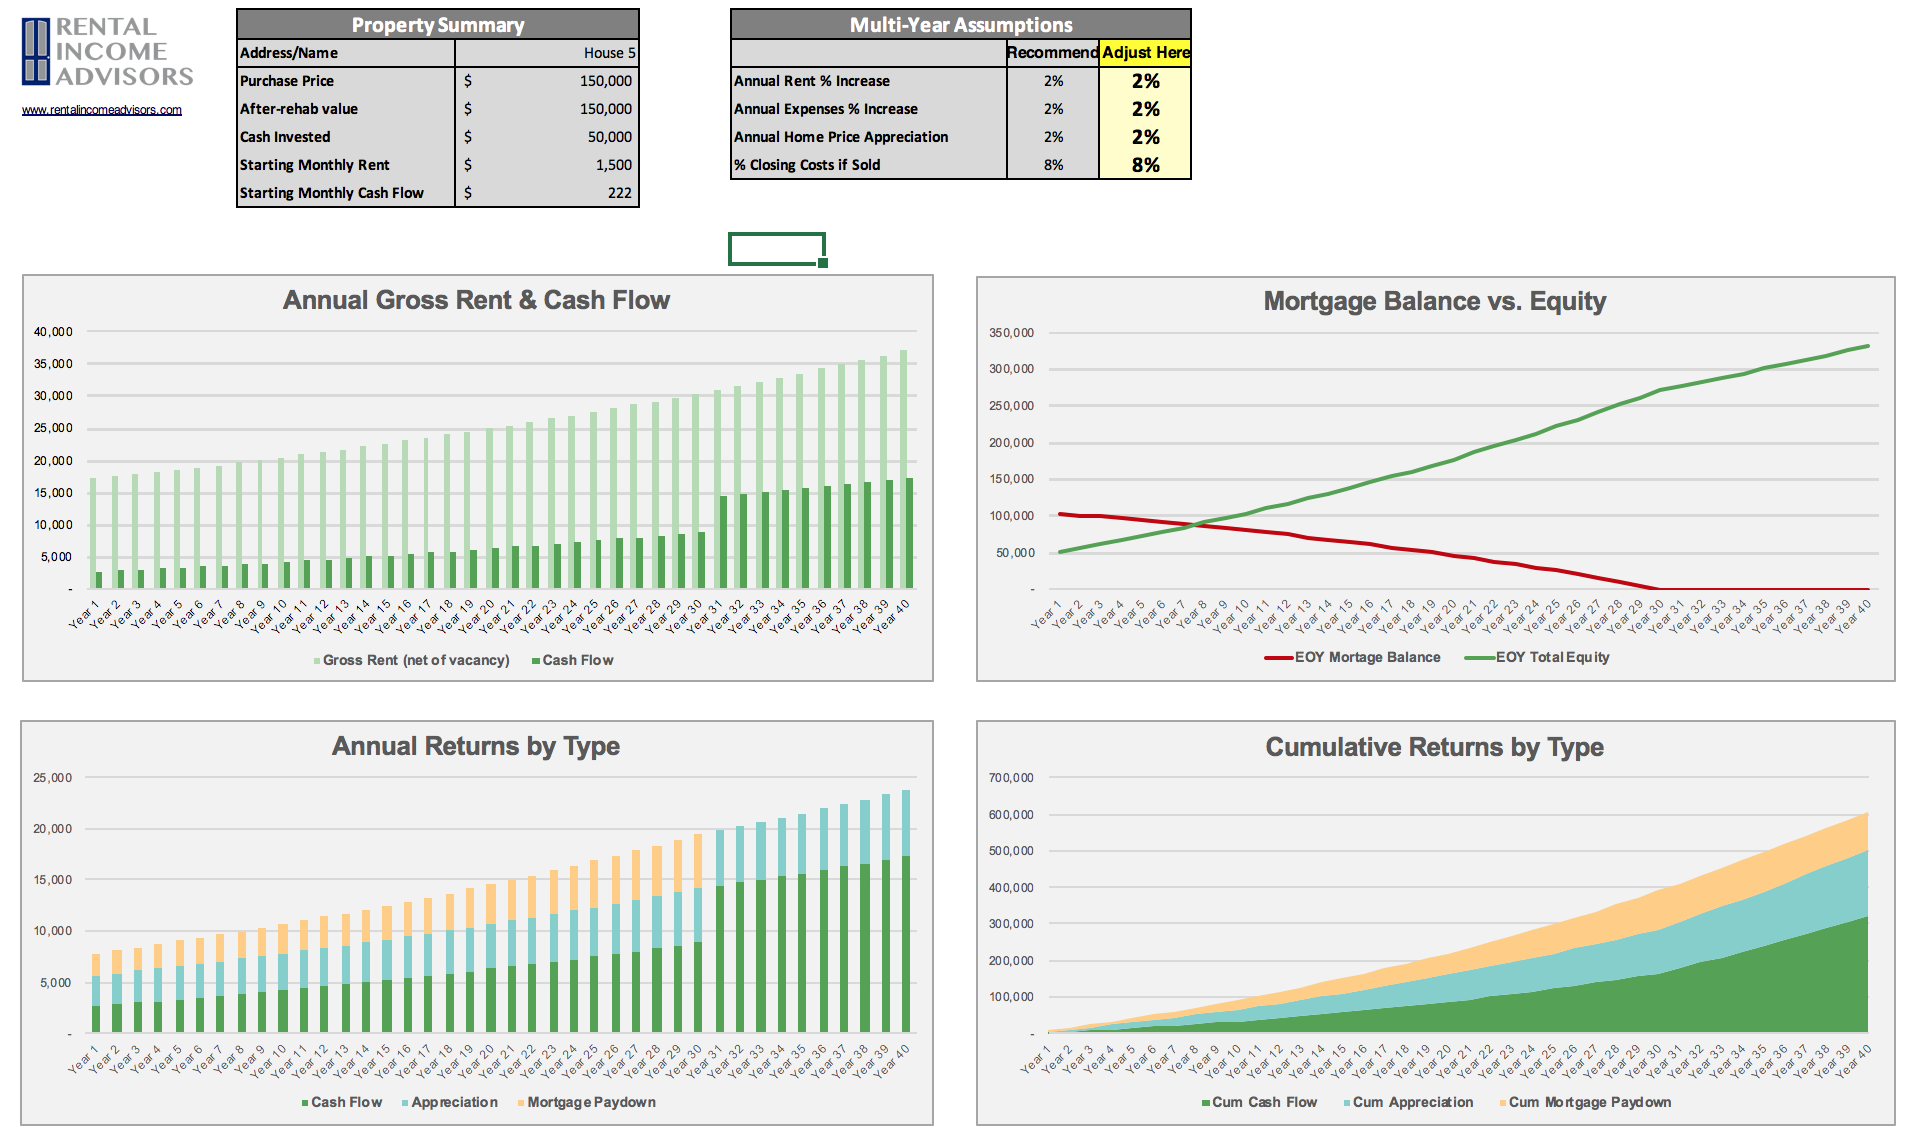
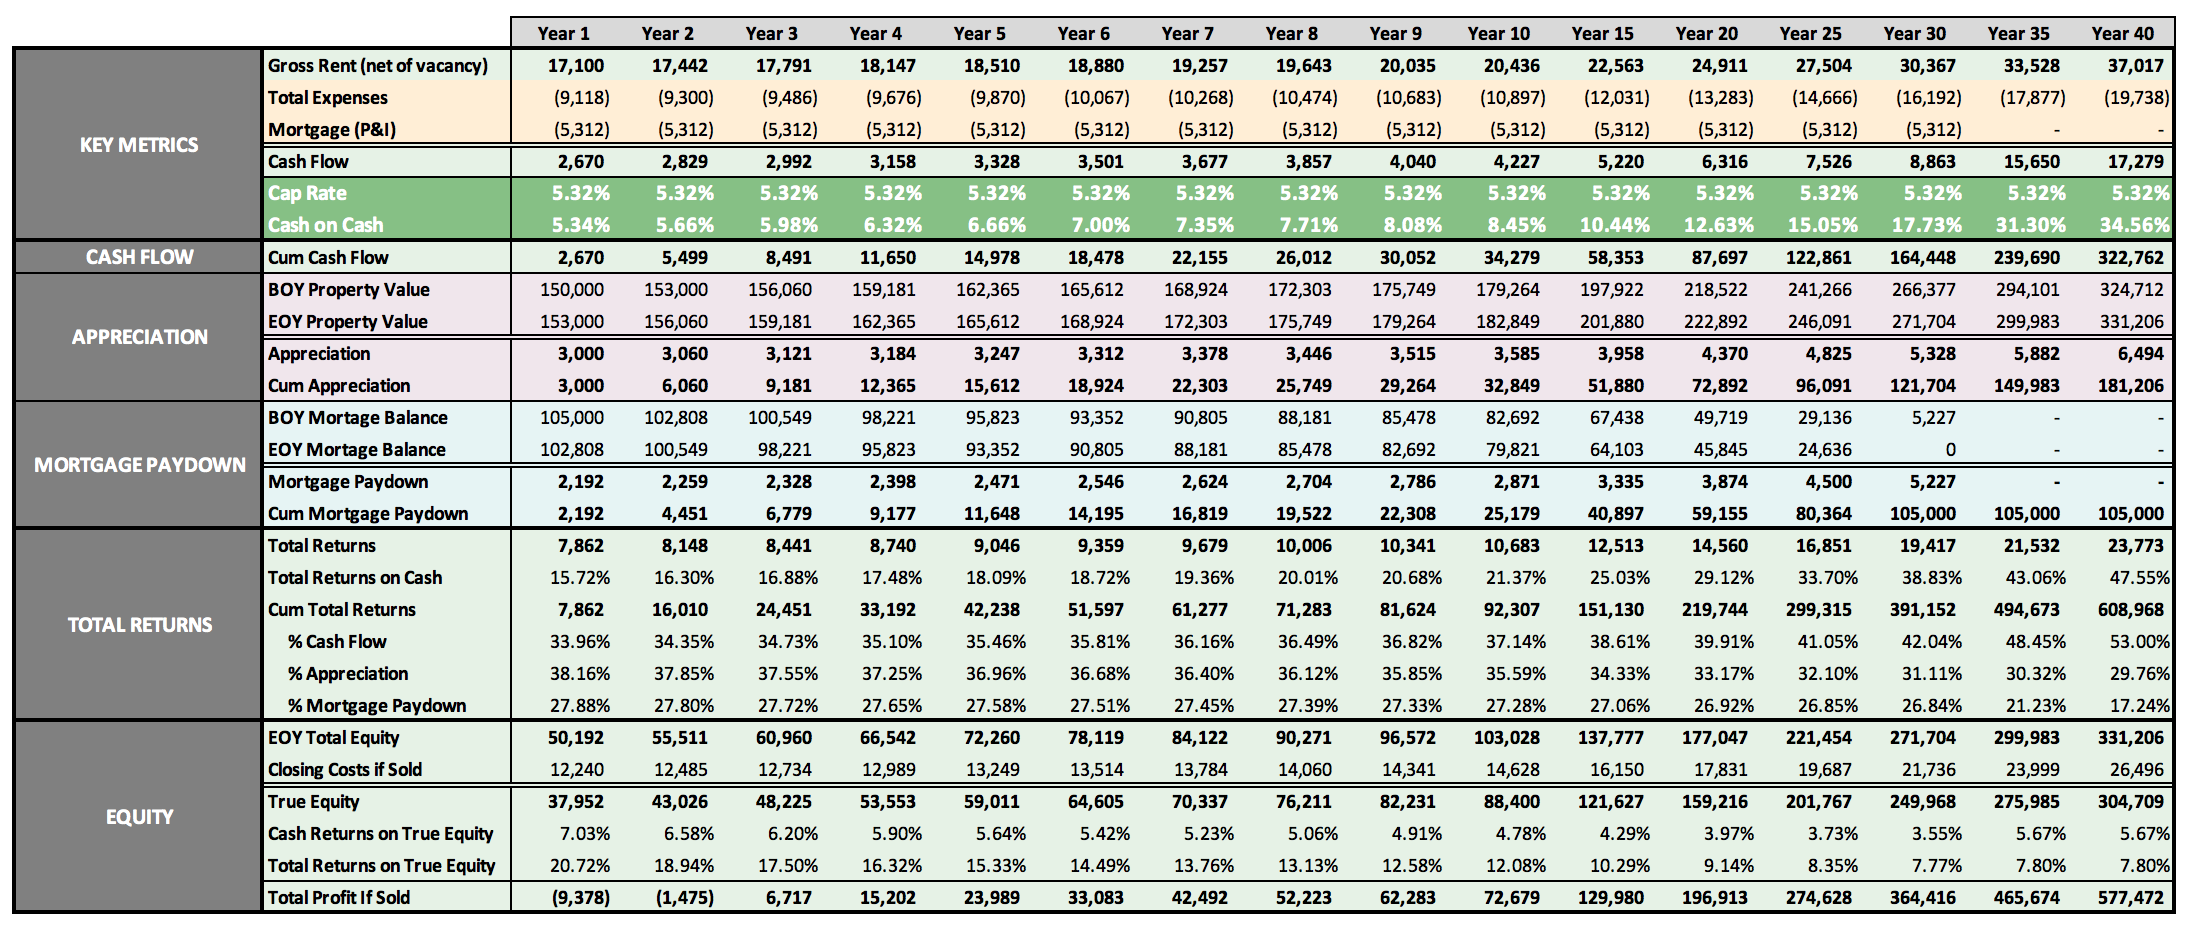
Check out the FREE RIA Property Analyzer. I guarantee this is the most intuitive, elegant, and powerful free tool you’ll find to run the financials on rental properties. I still use it every day, and so do all my coaching clients.
Here’s what the Property Analyzer looks like:
About the Author
Hi, I’m Eric! I used cash-flowing rental properties to leave my corporate career at age 39. I started Rental Income Advisors in 2020 to help other people achieve their own goals through real estate investing.
My blog focuses on learning & education for new investors, and I make numerous tools & resources available for free, including my industry-leading Rental Property Analyzer.
I also now serve as a coach to dozens of private clients starting their own journeys investing in rental properties, and have helped my clients buy millions of dollars (and counting) in real estate. To chat with me about coaching, schedule a free initial consultation.
