Monthly Portfolio Report: December 2020
One of my goals with Rental Income Advisors is to be as transparent and data-driven as possible with my readers and my coaching clients. I think the best way to build confidence in a new investor is to actually show the numbers, to prove that rental property investing really does work as advertised.
For those reasons, I publish a monthly report on my portfolio’s performance. I hope that this chronological history paints a clear picture of what it’s like to be a remote landlord. It’s also a great exercise for me to be sure I’m staying plugged in to all my numbers.
Here is the update for December 2020.
Property Overview
With the addition of Property #18 (a duplex) to the numbers this month, I’ve had to change “Properties” to “Doors” in order to correctly express my occupancy. As I mentioned in last month’s update, one side of this duplex was occupied at closing, and the other side needed a rehab. That rehab is now complete, and a tenant is scheduled to move in this week — but it was still vacant for the month of December, which accounts for my occupancy being less than 100%. I’ll publish a post in the next few weeks with the specifics on this new property, along the lines of what I did for Memphis Property #17. (UPDATE: Here is that post on Memphis Property #18!)
I also mentioned last month that I had a tenant break his lease suddenly at Property #13. Because he came in to my property manager’s office to inform them and turn in his keys, I was hoping he had left the property in good shape. No such luck — the place was a mess, and the turn was pretty expensive. (He even left a junk car in the driveway! My PM took care of having the city haul it away.) But there is still some good news to report on all this:
The tenant’s security deposit was ~1.5x monthly rent, or $1,470. Because he broke his lease, my property manager released the full security deposit to me. That’s why I count this property as occupied in December — there was no tenant, but it was still generating income for me, and that’s what I use as my definition of “occupied” when I calculate my vacancy rate.
I used the opportunity to take care of some deferred maintenance on the property, such as replacing the carpeting in the bedrooms with more durable LVP (luxury vinyl plank).
I was hoping to be able to re-rent the property for ~$100 more than the previous tenant was paying, given that rents in the area have increased. In the end, I was able to rent it for $200 more! This will dramatically improve the financial performance of this house going forward.
Finally, I’m expected to close on Property #19 in early February. This will be my 20th door in Memphis! More on this property in future updates.
Rents
In addition to being fully collected in December, I booked the $1470 security deposit from Property #13, as well as another $200 from the resolution of an accounting issue with another tenant.
With more aid recently passed by Congress, I’m optimistic that we’ll get through the pandemic without any significant impact to my rental business. I would NEVER have predicted that in March of last year! It’s a testament to the resiliency of rental properties as an investment vehicle.
Expenses
Just like in November, expenses were unusually high this month:
Maintenance & Repairs: You can see the impact of the costly tenant turn at Property #13. Also notice that I separate my expenses into “General”, which is ongoing maintenance on occupied properties, and “Rent Ready” which is for turn expenses.
Insurance: Because I ended up buying Property #18 in cash, I’ll be paying insurance directly to the provider (rather than through escrow). This amount covers the first 12 months.
Utilities: Whenever a property is vacant, the landlord must pay the utility bill. I had two vacant units in December where I was responsible for the utilities.
The Bottom Line
With the addition of Property #18, my financial model projects my Memphis portfolio to generate $4,996 of positive cash flow in an average month. (I won’t add in the cash flow numbers on the rehabbed side of the duplex until it's occupied next month.) In December, the positive cash flow was $3,763, more than $1K below the expected average. This was mostly the result of the high turnover costs at Property #13, without which it would have been a very strong month.
Finally, here’s the running tally and graph I update each month. You can see that this month fell below my projected average monthly cash flow, as indicated by the dotted blue line. But this is more than offset by earlier months where cash flow was better than expected. For the year (since my first Portfolio Report in April) my cash flow has exceeded expectations by over $6K.
Free RIA Property Analyzer
Need help running the numbers on rental properties? Check out the FREE RIA Property Analyzer. I guarantee this is the most intuitive, elegant, and powerful free tool you’ll find to run the financials on rental properties.
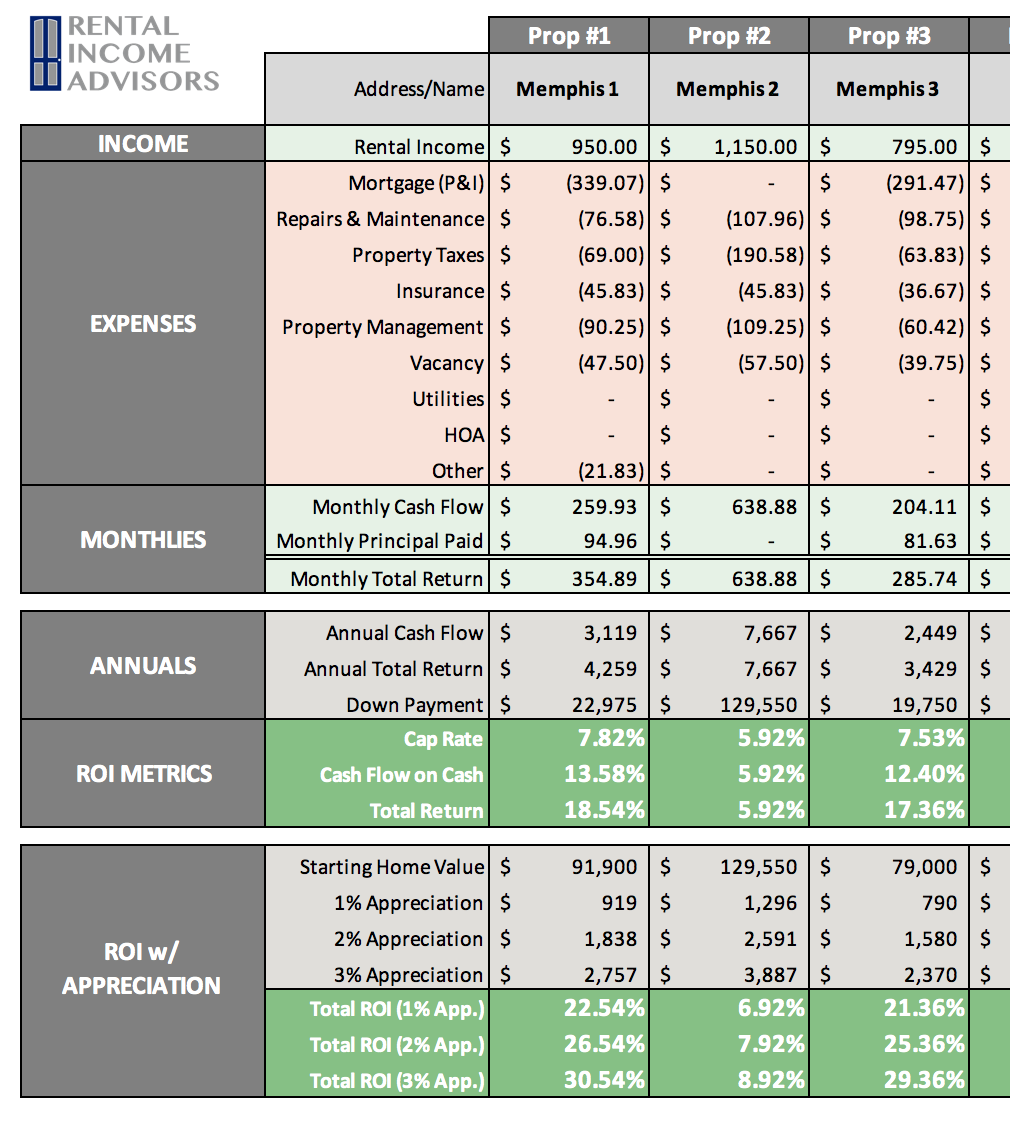
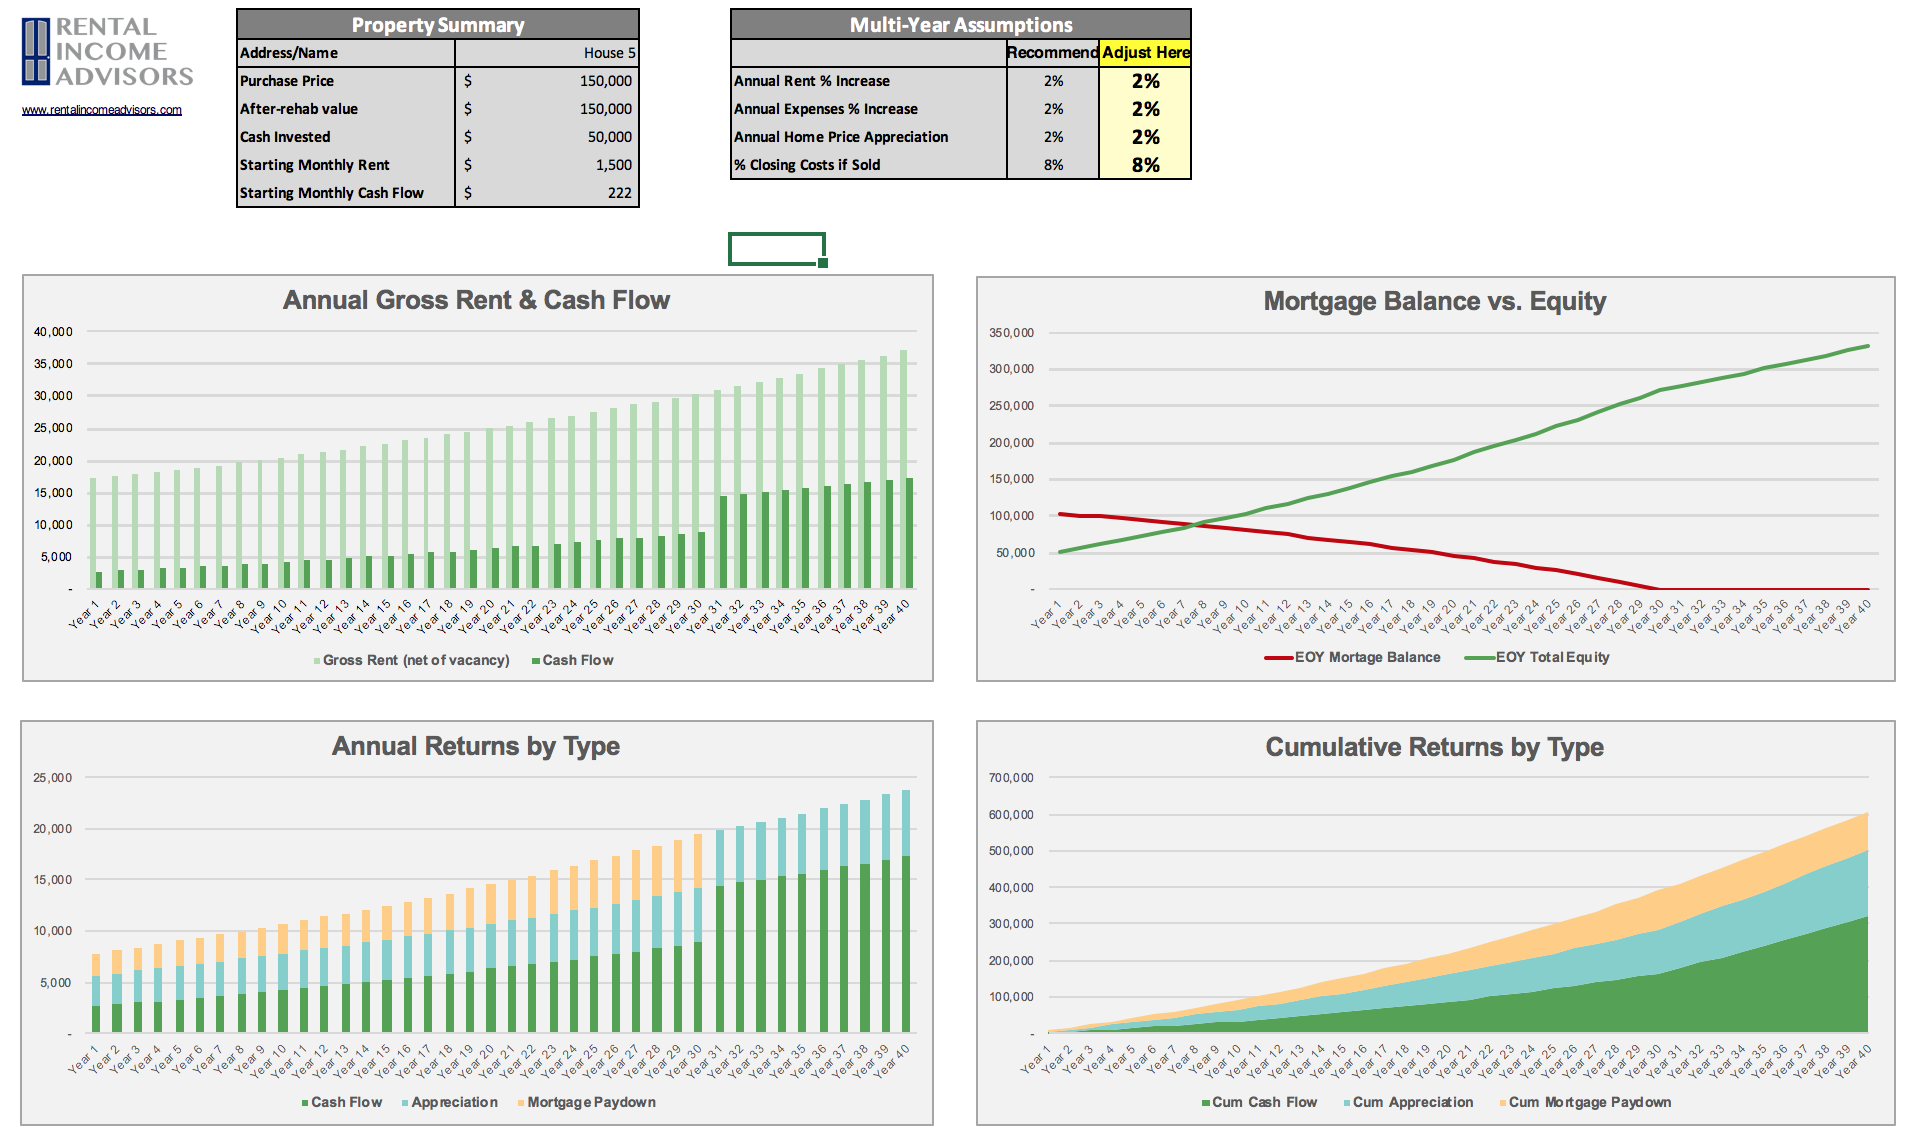
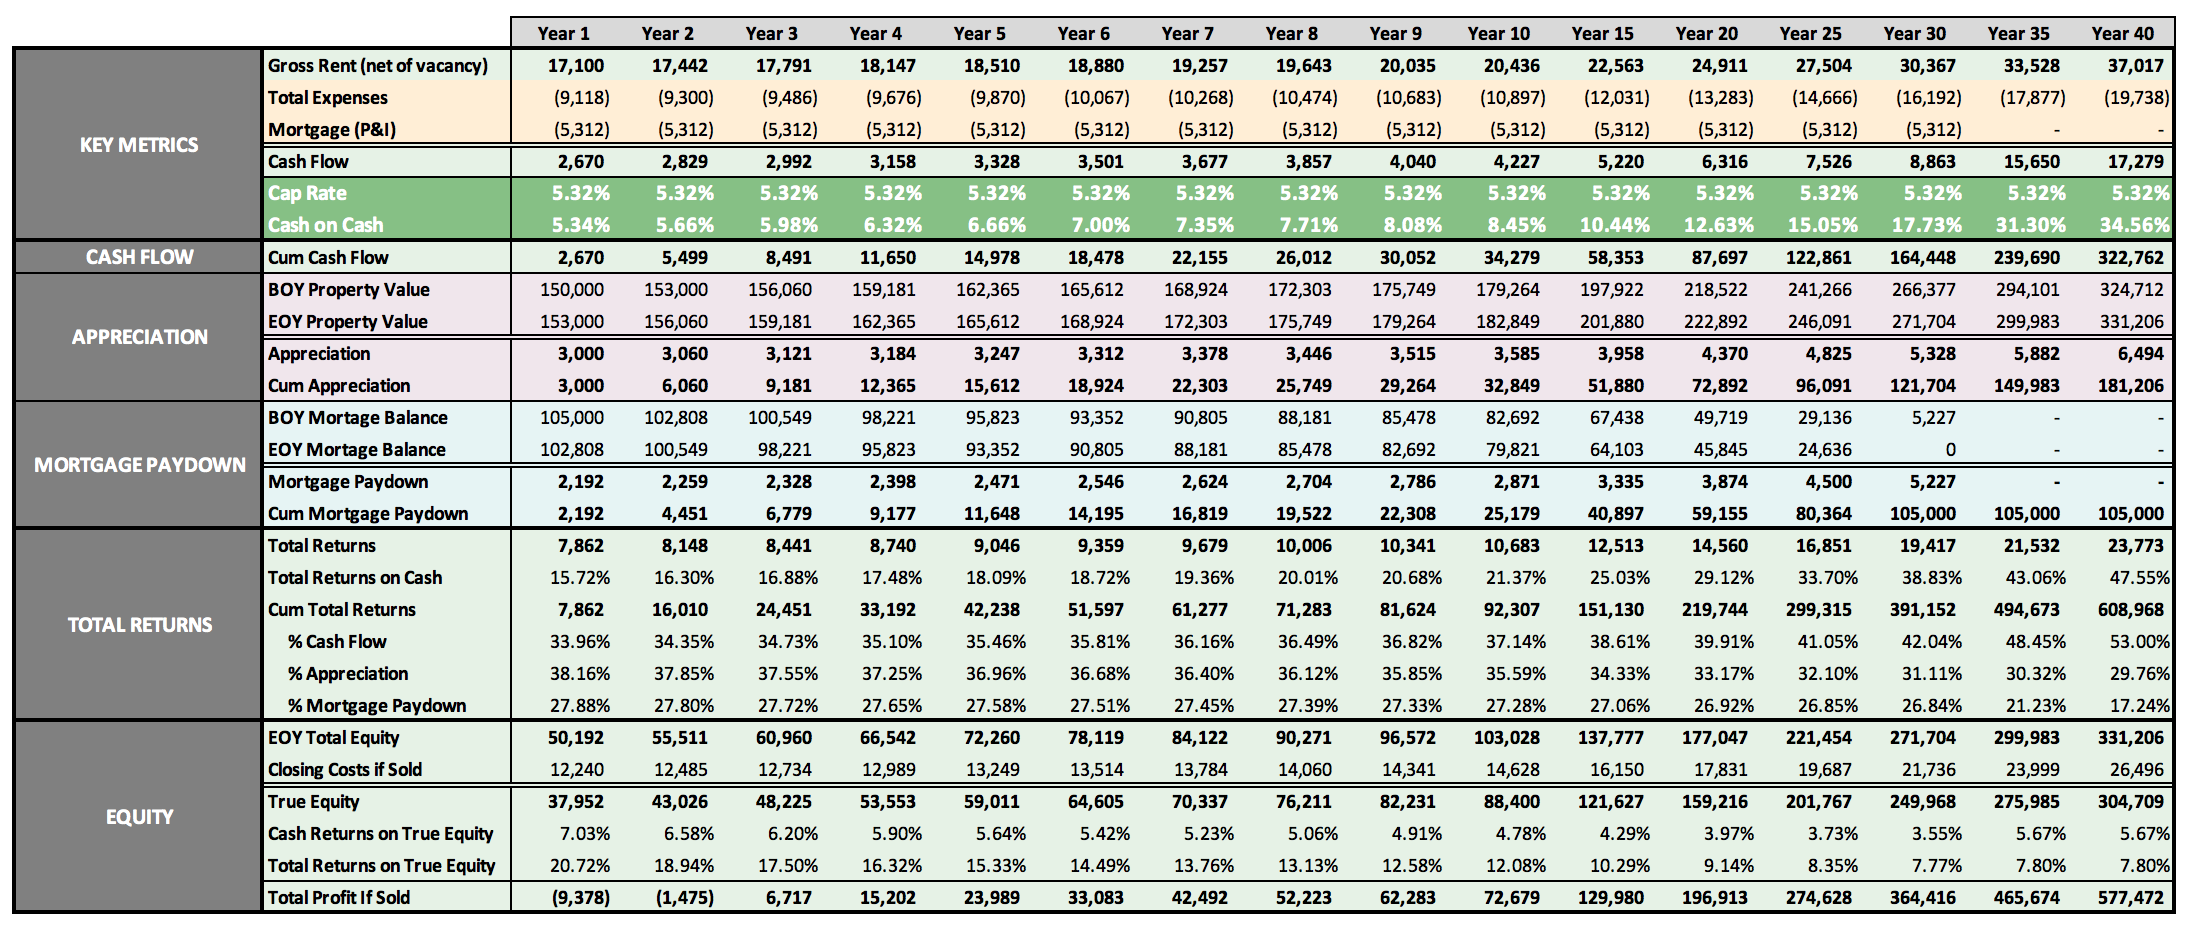
Here’s what the Property Analyzer looks like:
About the Author
Hi, I’m Eric! I used cash-flowing rental properties to leave my corporate career at age 39. I started Rental Income Advisors in 2020 to help other people achieve their own goals through real estate investing.
My blog focuses on learning & education for new investors, and I make numerous tools & resources available for free, including my industry-leading Rental Property Analyzer.
I also now serve as a coach to dozens of private clients starting their own journeys investing in rental properties, and have helped my clients buy millions of dollars (and counting) in real estate. To chat with me about coaching, schedule a free initial consultation.
