Monthly Portfolio Report: September 2020
One of my goals with Rental Income Advisors is to be as transparent and data-driven as possible with my readers and my coaching clients. I think the best way to build confidence in a new investor is to actually show the numbers, to prove that rental property investing really does work as advertised.
For those reasons, I publish a monthly report on my portfolio’s performance. I hope that this chronological history paints a clear picture of what it’s like to be a remote landlord. It’s also a great exercise for me to be sure I’m staying plugged in to all my numbers.
Here is the update for September 2020.
Property Overview

I continue to maintain full occupancy. Bonus!
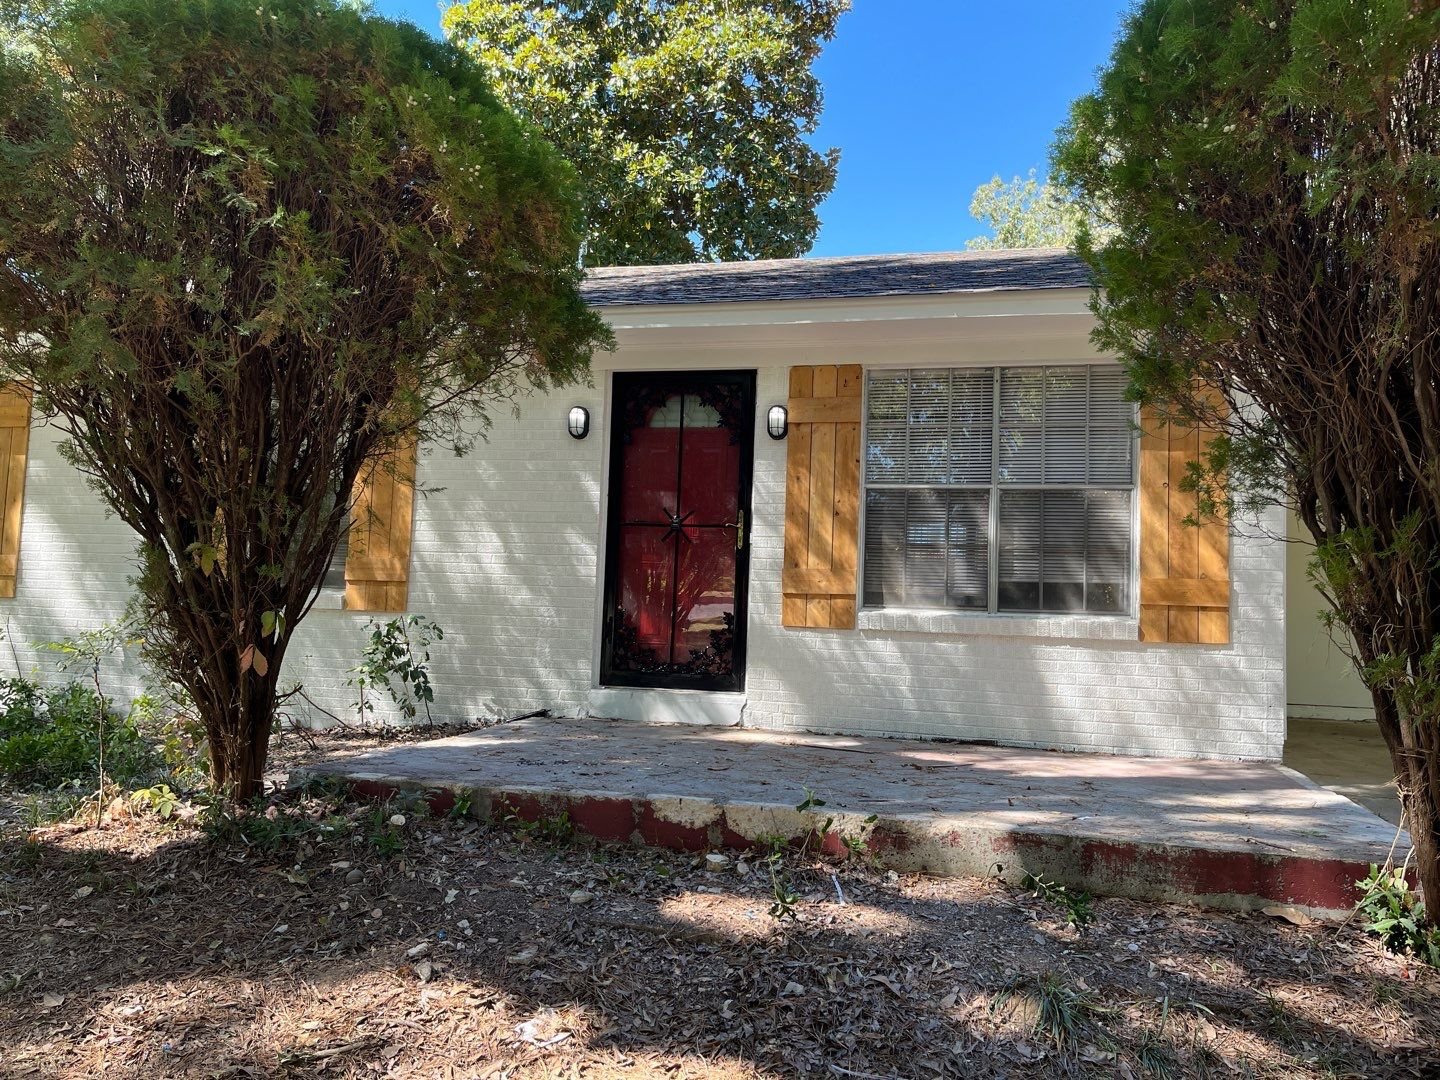
Also, I’m now officially up to 17 properties! In the thumbnail image for this blog post, you can see Property #17 added as a blue pin. (You can read all about all the details of this new property in this article.) Property #17’s financial numbers are excluded from this update — October will be the first full month of ownership, so I’ll start including them in next month’s report.
You might also have noticed a red pin on the map — that’s Property #18. I hope to close by the end of October, so more to come on that one!
Rents

Almost fully collected this month; one tenant was just a bit short.
Though the pandemic continues to impact the economy all over the country, I have luckily still not seen any negative impact on my tenants’ rent payments. Fingers crossed that this continues to be the case, despite the continuing lack of any additional federal aid from Congress.
Expenses

Very straightforward month of expenses — just my regular mortgage and property management costs, and lower-than-average maintenance & repairs expenses.
Maintenance & Repairs: Only two homes had maintenance visits this month, one for HVAC repair and one for an electrical issue.
The Bottom Line

My financial model projects my Memphis portfolio to generate $4,375 per month in positive cash flow. In September, the positive cash flow was $6,230, which is almost $2K more than expected. This was a result of very low maintenance costs this month, along with full occupancy and 100% collections. (Recall that in any good expense model, you have a budget line item for vacancies, so any month with zero vacancy results in a “bonus” vs. your projections.)
Finally, here’s the running tally and graph I update each month. After one month “below the line”, I’m back above my projected AVERAGE monthly cash flow. In fact, this was my best month so far this year!

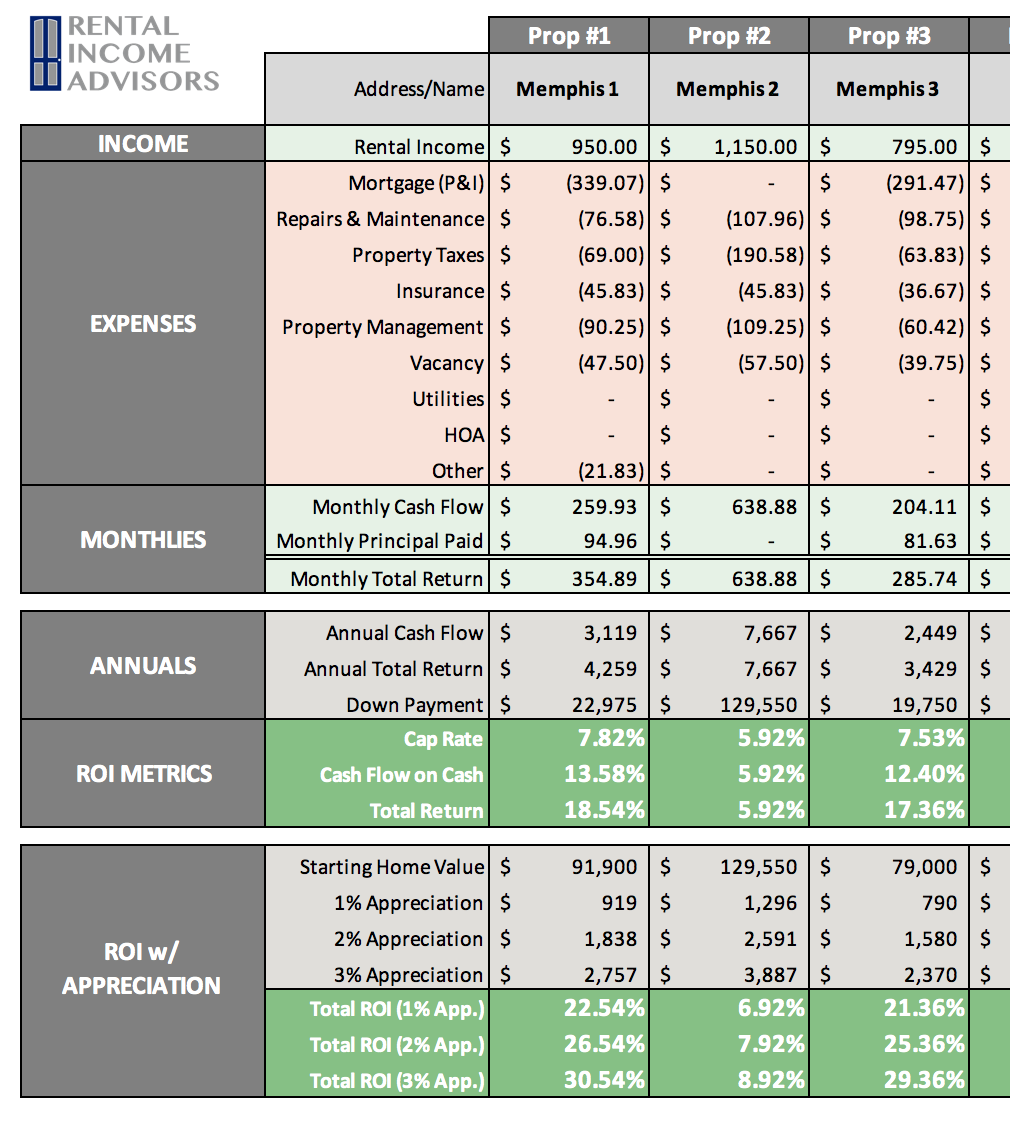
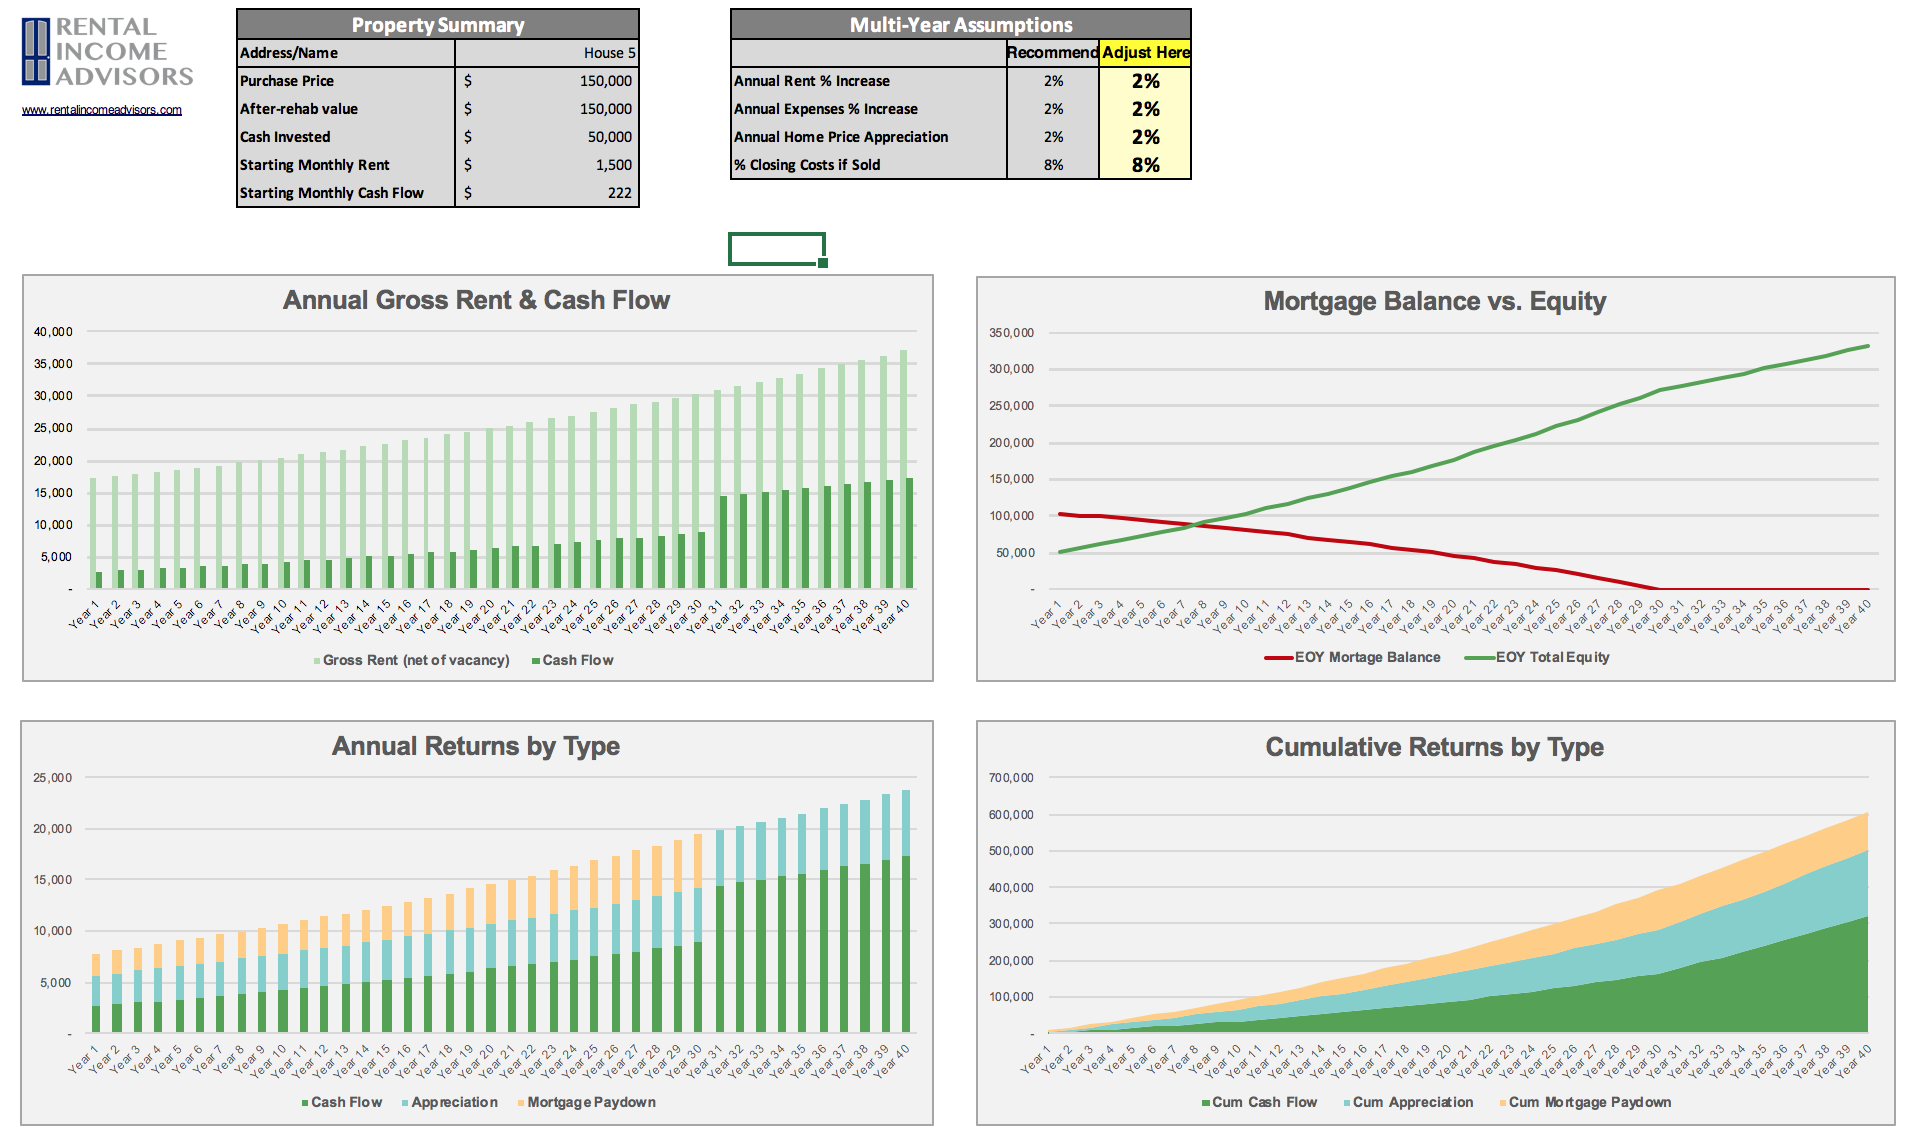
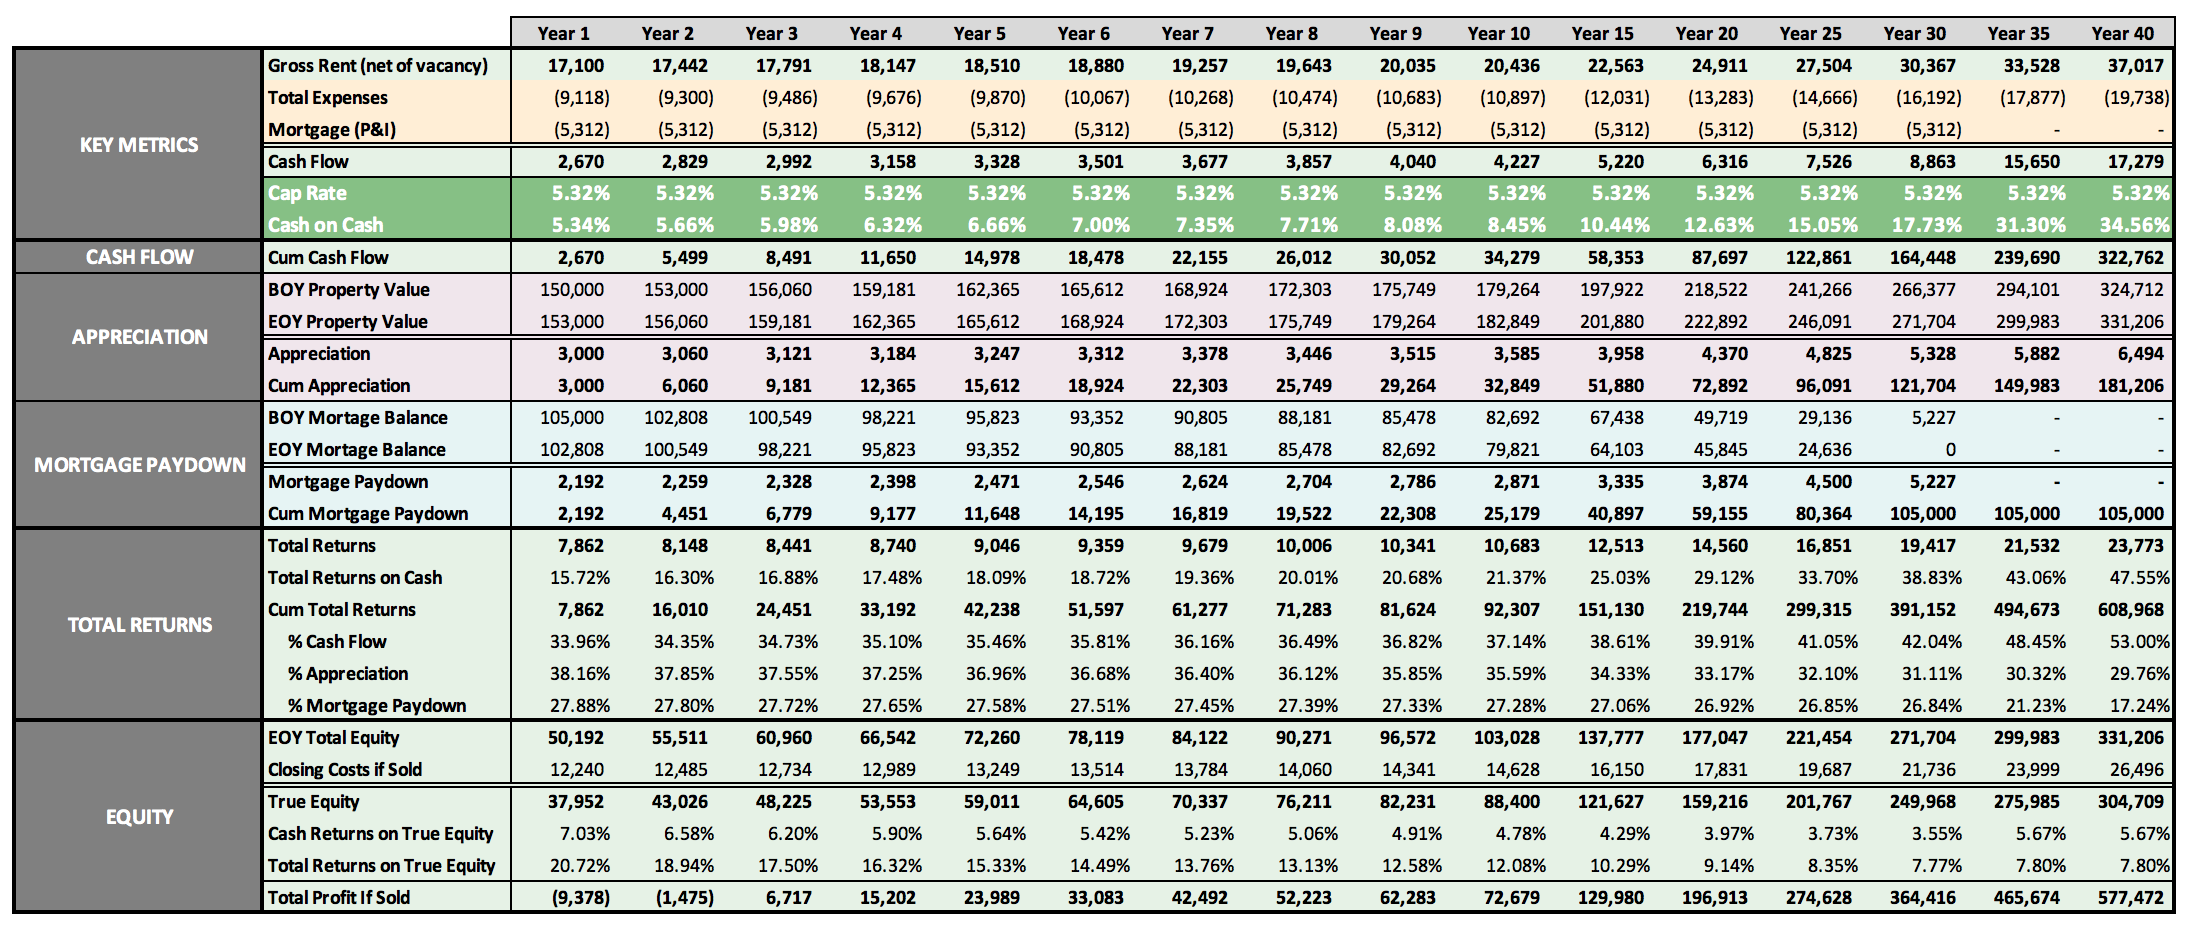
Free RIA Property Analyzer
Need help running the numbers on your own properties? Get the FREE RIA Property Analyzer. I guarantee this is the most intuitive, elegant, and powerful free tool you’ll find to run the financials on rental properties.
About the Author
Hi, I’m Eric! I used cash-flowing rental properties to leave my corporate career at age 39. I started Rental Income Advisors in 2020 to help other people achieve their own goals through real estate investing.
My blog focuses on learning & education for new investors, and I make numerous tools & resources available for free, including my industry-leading Rental Property Analyzer.
I also now serve as a coach to dozens of private clients starting their own journeys investing in rental properties, and have helped my clients buy millions of dollars (and counting) in real estate. To chat with me about coaching, schedule a free initial consultation.